mirror of
https://github.com/kamranahmedse/developer-roadmap.git
synced 2026-03-13 10:11:55 +08:00
Compare commits
1 Commits
dashboard
...
fix/modal-
| Author | SHA1 | Date | |
|---|---|---|---|
|
|
91655103ce |
@@ -3,6 +3,6 @@
|
||||
"enabled": false
|
||||
},
|
||||
"_variables": {
|
||||
"lastUpdateCheck": 1739229597159
|
||||
"lastUpdateCheck": 1737069970237
|
||||
}
|
||||
}
|
||||
@@ -1,4 +1,3 @@
|
||||
PUBLIC_API_URL=https://api.roadmap.sh
|
||||
PUBLIC_AVATAR_BASE_URL=https://dodrc8eu8m09s.cloudfront.net/avatars
|
||||
PUBLIC_EDITOR_APP_URL=https://draw.roadmap.sh
|
||||
PUBLIC_COURSE_APP_URL=http://localhost:5173
|
||||
PUBLIC_EDITOR_APP_URL=https://draw.roadmap.sh
|
||||
2
.github/workflows/cloudfront-fe-cache.yml
vendored
2
.github/workflows/cloudfront-fe-cache.yml
vendored
@@ -13,4 +13,4 @@ jobs:
|
||||
-H "Authorization: Bearer ${{ secrets.GH_PAT }}" \
|
||||
-H "X-GitHub-Api-Version: 2022-11-28" \
|
||||
https://api.github.com/repos/roadmapsh/infra-ansible/actions/workflows/playbook.yml/dispatches \
|
||||
-d '{ "ref":"master", "inputs": { "playbook": "roadmap_web.yml", "tags": "cloudfront,cloudfront-course", "is_verbose": false } }'
|
||||
-d '{ "ref":"master", "inputs": { "playbook": "roadmap_web.yml", "tags": "cloudfront", "is_verbose": false } }'
|
||||
|
||||
18
.github/workflows/greetings.yml
vendored
18
.github/workflows/greetings.yml
vendored
@@ -15,9 +15,19 @@ jobs:
|
||||
- uses: actions/first-interaction@v1
|
||||
with:
|
||||
repo-token: ${{ secrets.GITHUB_TOKEN }}
|
||||
pr-message: |
|
||||
Thank you for your first ever contribution to [roadmap.sh](https://roadmap.sh)! 🎉
|
||||
issue-message: |
|
||||
🙌 Hello! Thank you for taking the time to file an issue.
|
||||
|
||||
Please make sure to follow the [contribution guidelines](https://github.com/kamranahmedse/developer-roadmap/blob/master/contributing.md) when contributing to this project. Any PRs that don't follow the guidelines will be closed.
|
||||
If this is a bug report, please include any relevant logs or details that can help us debug the problem. Your help is greatly appreciated! 💡
|
||||
|
||||
Thanks for choosing to contribute, and for helping make this project better! 🌟
|
||||
We'll get back to you as soon as possible, kindly be patient for a response from a maintainer.
|
||||
pr-message: |
|
||||
🎉 Warm regards and welcome! Thank you for your first ever contribution to **Roadmap.sh**!
|
||||
|
||||
We appreciate your effort and enthusiasm. Before diving in, we kindly ask you to take a moment to go through our [Contribution Guidelines](https://github.com/kamranahmedse/developer-roadmap/blob/master/contributing.md) 📘 to ensure your contribution aligns with the project's standards and goals.
|
||||
|
||||
If you are fixing a bug, please reference the associated issue number in your pull request description. 🐛
|
||||
|
||||
If you're working on a new feature, feel free to check with the community on [discord](https://roadmap.sh/discord) to ensure the feature will be accepted. *Also, kindly refrain pinging the maintainer(s).* 🚀
|
||||
|
||||
Thanks for choosing to contribute, and for making this project better! 🌟
|
||||
@@ -67,12 +67,10 @@
|
||||
"rehype-external-links": "^3.0.0",
|
||||
"remark-parse": "^11.0.0",
|
||||
"roadmap-renderer": "^1.0.6",
|
||||
"sanitize-html": "^2.13.1",
|
||||
"satori": "^0.11.2",
|
||||
"satori-html": "^0.3.2",
|
||||
"sharp": "^0.33.5",
|
||||
"slugify": "^1.6.6",
|
||||
"tiptap-markdown": "^0.8.10",
|
||||
"tailwind-merge": "^2.5.3",
|
||||
"tailwindcss": "^3.4.13",
|
||||
"turndown": "^7.2.0",
|
||||
@@ -88,7 +86,6 @@
|
||||
"@types/prismjs": "^1.26.4",
|
||||
"@types/react-calendar-heatmap": "^1.6.7",
|
||||
"@types/react-slick": "^0.23.13",
|
||||
"@types/sanitize-html": "^2.13.0",
|
||||
"@types/turndown": "^5.0.5",
|
||||
"csv-parser": "^3.0.0",
|
||||
"gh-pages": "^6.2.0",
|
||||
|
||||
2718
pnpm-lock.yaml
generated
2718
pnpm-lock.yaml
generated
File diff suppressed because it is too large
Load Diff
@@ -632,26 +632,10 @@
|
||||
}
|
||||
]
|
||||
},
|
||||
"lhIU0ulpvDAn1Xc3ooYz_": {
|
||||
"title": "Bias and Fairness",
|
||||
"description": "Bias and fairness in AI refer to the challenges of ensuring that machine learning models do not produce discriminatory or skewed outcomes. Bias can arise from imbalanced training data, flawed assumptions, or biased algorithms, leading to unfair treatment of certain groups based on race, gender, or other factors. Fairness aims to address these issues by developing techniques to detect, mitigate, and prevent biases in AI systems. Ensuring fairness involves improving data diversity, applying fairness constraints during model training, and continuously monitoring models in production to avoid unintended consequences, promoting ethical and equitable AI use.\n\nLearn more from the following resources:",
|
||||
"links": [
|
||||
{
|
||||
"title": "What Do We Do About the Biases in AI?",
|
||||
"url": "https://hbr.org/2019/10/what-do-we-do-about-the-biases-in-ai",
|
||||
"type": "article"
|
||||
},
|
||||
{
|
||||
"title": "AI Bias - What Is It and How to Avoid It?",
|
||||
"url": "https://levity.ai/blog/ai-bias-how-to-avoid",
|
||||
"type": "article"
|
||||
},
|
||||
{
|
||||
"title": "What about fairness, bias and discrimination?",
|
||||
"url": "https://ico.org.uk/for-organisations/uk-gdpr-guidance-and-resources/artificial-intelligence/guidance-on-ai-and-data-protection/how-do-we-ensure-fairness-in-ai/what-about-fairness-bias-and-discrimination/",
|
||||
"type": "article"
|
||||
}
|
||||
]
|
||||
"bias-and-fareness@lhIU0ulpvDAn1Xc3ooYz_.md": {
|
||||
"title": "Bias and Fareness",
|
||||
"description": "",
|
||||
"links": []
|
||||
},
|
||||
"sWBT-j2cRuFqRFYtV_5TK": {
|
||||
"title": "Security and Privacy Concerns",
|
||||
|
||||
@@ -709,7 +709,7 @@
|
||||
"links": [
|
||||
{
|
||||
"title": "API Authorization Methods",
|
||||
"url": "https://www.pingidentity.com/en/resources/identity-fundamentals/authorization/authorization-methods.html",
|
||||
"url": "https://konghq.com/blog/engineering/common-api-authentication-methods",
|
||||
"type": "article"
|
||||
}
|
||||
]
|
||||
|
||||
@@ -629,7 +629,7 @@
|
||||
"type": "article"
|
||||
},
|
||||
{
|
||||
"title": "MySQL Complete Course",
|
||||
"title": "MySQL Full Course for free",
|
||||
"url": "https://www.youtube.com/watch?v=5OdVJbNCSso",
|
||||
"type": "video"
|
||||
}
|
||||
|
||||
@@ -2668,7 +2668,7 @@
|
||||
},
|
||||
"0btHNkzWL1w_-pUgU_k2y": {
|
||||
"title": "P = NP",
|
||||
"description": "The P = NP problem is one of the most famous problems in computer science. It asks whether a problem that can be solved in polynomial time on a non-deterministic machine (i.e., the problem is in NP) can also be solved in polynomial time on a deterministic machine (i.e., the problem is in P).\n\nIf you can find a polynomial-time solution to an NP-complete problem, then all problems in NP can be solved in polynomial time. This shows that P = NP.\n\nIf you can prove for any single NP-complete problem that it is only solvable in exponential time, then all NP-complete problems are only solvable in exponential time. This shows that P ≠ NP.\n\nSo far, we don't know whether P = NP or P ≠ NP.\n\nVisit the following resources to learn more:",
|
||||
"description": "The P = NP problem is one of the most famous problems in computer science. It asks if the problem of determining if a given input belongs to a certain class of problems is as hard as the problem of solving the given input. In other words, it asks if the problem of determining if a given input belongs to a certain class of problems is as hard as the problem of determining if a given input belongs to a certain class of problems. This problem is also known as the Halting Problem.\n\nVisit the following resources to learn more:",
|
||||
"links": [
|
||||
{
|
||||
"title": "Whats P=NP?, and why is it such a famous question?",
|
||||
@@ -3366,19 +3366,8 @@
|
||||
},
|
||||
"tcQSH-eAvJUZuePTDjAIb": {
|
||||
"title": "DML",
|
||||
"description": "The SQL commands that manipulate data in the database belong to DML, or Data Manipulation Language, and this includes most of the SQL statements. DCL is the component of the SQL statement that controls access to data and to the database. Basically, DCL statements are grouped with DML statements.\n\nVisit the following resources to learn more:",
|
||||
"links": [
|
||||
{
|
||||
"title": "DML: Data Manipulation Language",
|
||||
"url": "https://satoricyber.com/glossary/dml-data-manipulation-language",
|
||||
"type": "article"
|
||||
},
|
||||
{
|
||||
"title": "Difference Between DDL and DML",
|
||||
"url": "https://appmaster.io/blog/difference-between-ddl-and-dml",
|
||||
"type": "article"
|
||||
}
|
||||
]
|
||||
"description": "The SQL commands that deals with the manipulation of data present in the database belong to DML or Data Manipulation Language and this includes most of the SQL statements. It is the component of the SQL statement that controls access to data and to the database. Basically, DCL statements are grouped with DML statements.\n\nVisit the following resources to learn more:",
|
||||
"links": []
|
||||
},
|
||||
"05lkb3B86Won7Rkf-8DeD": {
|
||||
"title": "DQL",
|
||||
@@ -3942,7 +3931,7 @@
|
||||
},
|
||||
"GDLKJkKgB-i7n0YcV2NDa": {
|
||||
"title": "How Computers Calculate",
|
||||
"description": "Computers calculate using the binary system, where all data is represented as 0s and 1s. These binary states correspond to the ON/OFF positions of transistors, which are the building blocks of logic gates (AND, OR, NOT). Numbers, characters, and instructions are broken into binary sequences (bits), and grouped into bytes (8 bits). Arithmetic operations like addition are performed through logic gates, which combine binary values. The CPU executes these calculations by following a fetch-decode-execute cycle. Complex calculations, such as handling decimals, use floating-point representation. Programs written in high-level languages are compiled into machine code for the CPU to execute.\n\nVisit the following resources to learn more:",
|
||||
"description": "Visit the following resources to learn more:",
|
||||
"links": [
|
||||
{
|
||||
"title": "How computers calculate - ALU",
|
||||
|
||||
@@ -6,18 +6,12 @@
|
||||
},
|
||||
"yCnn-NfSxIybUQ2iTuUGq": {
|
||||
"title": "What is Data Analytics",
|
||||
"description": "Data Analytics is a core component of a Data Analyst's role. The field involves extracting meaningful insights from raw data to drive decision-making processes. It includes a wide range of techniques and disciplines ranging from the simple data compilation to advanced algorithms and statistical analysis. As a data analyst, you are expected to understand and interpret complex digital data, such as the usage statistics of a website, the sales figures of a company, or client engagement over social media, etc. This knowledge enables data analysts to support businesses in identifying trends, making informed decisions, predicting potential outcomes - hence playing a crucial role in shaping business strategies.\n\nLearn more from the following resources:",
|
||||
"links": [
|
||||
{
|
||||
"title": "Introduction to Data Analytics",
|
||||
"url": "https://www.coursera.org/learn/introduction-to-data-analytics",
|
||||
"type": "course"
|
||||
}
|
||||
]
|
||||
"description": "Data Analytics is a core component of a Data Analyst's role. The field involves extracting meaningful insights from raw data to drive decision-making processes. It includes a wide range of techniques and disciplines ranging from the simple data compilation to advanced algorithms and statistical analysis. As a data analyst, you are expected to understand and interpret complex digital data, such as the usage statistics of a website, the sales figures of a company, or client engagement over social media, etc. This knowledge enables data analysts to support businesses in identifying trends, making informed decisions, predicting potential outcomes - hence playing a crucial role in shaping business strategies.",
|
||||
"links": []
|
||||
},
|
||||
"Lsapbmg-eMIYJAHpV97nO": {
|
||||
"title": "Types of Data Analytics",
|
||||
"description": "Data Analytics has proven to be a critical part of decision-making in modern business ventures. It is responsible for discovering, interpreting, and transforming data into valuable information. Different types of data analytics look at past, present, or predictive views of business operations.\n\nData Analysts, as ambassadors of this domain, employ these types, to answer various questions:\n\n* Descriptive Analytics _(what happened in the past?)_\n* Diagnostic Analytics _(why did it happened in the past?)_\n* Predictive Analytics _(what will happen in the future?)_\n* Prescriptive Analytics _(how can we make it happen?)_\n\nVisit the following resources to learn more:",
|
||||
"description": "Data Analytics has proven to be a critical part of decision-making in modern business ventures. It is responsible for discovering, interpreting, and transforming data into valuable information. Different types of data analytics look at past, present, or predictive views of business operations.\n\nData Analysts, as ambassadors of this domain, employ these types, to answer various questions:\n\n* Descriptive Analytics _(what happened in the past?)_\n* Diagnostic Analytics _(why did it happened in the past?)_\n* Predictive Analytics _(what will happen in the future?)_\n* Prescriptive Analytics _(how can we make it happen?)_\n\nUnderstanding these types gives data analysts the power to transform raw datasets into strategic insights.\n\nVisit the following resources to learn more:",
|
||||
"links": [
|
||||
{
|
||||
"title": "Data Analytics and its type",
|
||||
@@ -78,12 +72,12 @@
|
||||
"description": "Predictive analysis is a crucial type of data analytics that any competent data analyst should comprehend. It refers to the practice of extracting information from existing data sets in order to determine patterns and forecast future outcomes and trends. Data analysts apply statistical algorithms, machine learning techniques, and artificial intelligence to the data to anticipate future results. Predictive analysis enables organizations to be proactive, forward-thinking, and strategic by providing them valuable insights on future occurrences. It's a powerful tool that gives companies a significant competitive edge by enabling risk management, opportunity identification, and strategic decision-making.\n\nLearn more from the following resources:",
|
||||
"links": [
|
||||
{
|
||||
"title": "What is Predictive Analytics? - Google",
|
||||
"title": "What is predictive analytics? - Google",
|
||||
"url": "https://cloud.google.com/learn/what-is-predictive-analytics",
|
||||
"type": "article"
|
||||
},
|
||||
{
|
||||
"title": "What is Predictive Analytics?",
|
||||
"title": "What is predictive analytics?",
|
||||
"url": "https://www.youtube.com/watch?v=cVibCHRSxB0",
|
||||
"type": "video"
|
||||
}
|
||||
@@ -131,7 +125,7 @@
|
||||
"description": "The Cleanup of Data is a critical component of a Data Analyst's role. It involves the process of inspecting, cleaning, transforming, and modeling data to discover useful information, inform conclusions, and support decision making. This process is crucial for Data Analysts to generate accurate and significant insights from data, ultimately resulting in better and more informed business decisions. A solid understanding of data cleanup procedures and techniques is a fundamental skill for any Data Analyst. Hence, it is necessary to hold a high emphasis on maintaining data quality by managing data integrity, accuracy, and consistency during the data cleanup process.\n\nLearn more from the following resources:",
|
||||
"links": [
|
||||
{
|
||||
"title": "Top 10 Ways to Clean Your Data",
|
||||
"title": "Top 10 ways to clean your data",
|
||||
"url": "https://support.microsoft.com/en-gb/office/top-ten-ways-to-clean-your-data-2844b620-677c-47a7-ac3e-c2e157d1db19",
|
||||
"type": "article"
|
||||
},
|
||||
@@ -163,7 +157,7 @@
|
||||
"description": "The visualization of data is an essential skill in the toolkit of every data analyst. This practice is about transforming complex raw data into a graphical format that allows for an easier understanding of large data sets, trends, outliers, and important patterns. Whether pie charts, line graphs, bar graphs, or heat maps, data visualization techniques not only streamline data analysis, but also facilitate a more effective communication of the findings to others. This key concept underscores the importance of presenting data in a digestible and visually appealing manner to drive data-informed decision making in an organization.\n\nLearn more from the following resources:",
|
||||
"links": [
|
||||
{
|
||||
"title": "Data Visualization Beginner's Guide",
|
||||
"title": "Data visualization beginner's guide",
|
||||
"url": "https://www.tableau.com/en-gb/learn/articles/data-visualization",
|
||||
"type": "article"
|
||||
},
|
||||
@@ -229,7 +223,7 @@
|
||||
},
|
||||
"yBlJrNo9eO470dLp6OaQZ": {
|
||||
"title": "DATEDIF",
|
||||
"description": "The `DATEDIF` function is an incredibly valuable tool for a Data Analyst in Excel or Google Sheets, by providing the ability to calculate the difference between two dates. This function takes in three parameters: start date, end date and the type of difference required (measured in years, months, days, etc.). In Data Analysis, particularly when dealing with time-series data or when you need to uncover trends over specific periods, the `DATEDIF` function is a necessary asset. Recognizing its functionality will enable a data analyst to manipulate or shape data progressively and efficiently.\n\n`DATEDIF` is technically still supported, but wont show as an option. For additional information, see Excel \"Help\" page.\n\nLearn more from the following resources:",
|
||||
"description": "The `DATEDIF` function is an incredibly valuable tool for a Data Analyst in Excel or Google Sheets, by providing the ability to calculate the difference between two dates. This function takes in three parameters: start date, end date and the type of difference required (measured in years, months, days, etc.). In Data Analysis, particularly when dealing with time-series data or when you need to uncover trends over specific periods, the `DATEDIF` function is a necessary asset. Recognizing its functionality will enable a data analyst to manipulate or shape data progressively and efficiently.\n\n* `DATEDIF` is technically still supported, but wont show as an option. For additional information, see Excel \"Help\" page.\n\nLearn more from the following resources:",
|
||||
"links": [
|
||||
{
|
||||
"title": "DATEDIF function",
|
||||
@@ -413,17 +407,17 @@
|
||||
"description": "Data Analysts recurrently find the need to summarize, investigate, and analyze their data to make meaningful and insightful decisions. One of the most powerful tools to accomplish this in Microsoft Excel is the Pivot Table. Pivot Tables allow analysts to organize and summarize large quantities of data in a concise, tabular format. The strength of pivot tables comes from their ability to manipulate data dynamically, leading to quicker analysis and richer insights. Understanding and employing Pivot Tables efficiently is a fundamental skill for any data analyst, as it directly impacts their ability to derive significant information from raw datasets.\n\nLearn more from the following resources:",
|
||||
"links": [
|
||||
{
|
||||
"title": "Create a Pivot Table",
|
||||
"title": "Create a pivot table",
|
||||
"url": "https://support.microsoft.com/en-gb/office/create-a-pivottable-to-analyze-worksheet-data-a9a84538-bfe9-40a9-a8e9-f99134456576",
|
||||
"type": "article"
|
||||
},
|
||||
{
|
||||
"title": "Pivot Tables in Excel",
|
||||
"title": "Pivot tables in excel",
|
||||
"url": "https://www.excel-easy.com/data-analysis/pivot-tables.html",
|
||||
"type": "article"
|
||||
},
|
||||
{
|
||||
"title": "How to Create a Pivot Table in Excel",
|
||||
"title": "How to create a pivot table in excel",
|
||||
"url": "https://www.youtube.com/watch?v=PdJzy956wo4",
|
||||
"type": "video"
|
||||
}
|
||||
@@ -458,31 +452,15 @@
|
||||
},
|
||||
"M1QtGTLyygIjePoCfvjve": {
|
||||
"title": "Data Manipulation Libraries",
|
||||
"description": "Data manipulation libraries are essential tools in data science and analytics, enabling efficient handling, transformation, and analysis of large datasets. Python, a popular language for data science, offers several powerful libraries for this purpose. Pandas is a highly versatile library that provides data structures like DataFrames, which allow for easy manipulation and analysis of tabular data. NumPy, another fundamental library, offers support for large, multi-dimensional arrays and matrices, along with a collection of mathematical functions to operate on these arrays. Together, Pandas and NumPy form the backbone of data manipulation in Python, facilitating tasks such as data cleaning, merging, reshaping, and statistical analysis, thus streamlining the data preparation process for machine learning and other data-driven applications.\n\nLearn more from the following resources:",
|
||||
"links": [
|
||||
{
|
||||
"title": "Pandas",
|
||||
"url": "https://pandas.pydata.org/",
|
||||
"type": "article"
|
||||
},
|
||||
{
|
||||
"title": "NumPy",
|
||||
"url": "https://numpy.org/",
|
||||
"type": "article"
|
||||
},
|
||||
{
|
||||
"title": "Top Python Libraries for Data Science",
|
||||
"url": "https://www.simplilearn.com/top-python-libraries-for-data-science-article",
|
||||
"type": "article"
|
||||
}
|
||||
]
|
||||
"description": "Data manipulation libraries are essential tools in data science and analytics, enabling efficient handling, transformation, and analysis of large datasets. Python, a popular language for data science, offers several powerful libraries for this purpose. Pandas is a highly versatile library that provides data structures like DataFrames, which allow for easy manipulation and analysis of tabular data. NumPy, another fundamental library, offers support for large, multi-dimensional arrays and matrices, along with a collection of mathematical functions to operate on these arrays. Together, Pandas and NumPy form the backbone of data manipulation in Python, facilitating tasks such as data cleaning, merging, reshaping, and statistical analysis, thus streamlining the data preparation process for machine learning and other data-driven applications.",
|
||||
"links": []
|
||||
},
|
||||
"8OXmF2Gn6TYJotBRvDjqA": {
|
||||
"title": "Pandas",
|
||||
"description": "Pandas is a widely acknowledged and highly useful data manipulation library in the world of data analysis. Known for its robust features like data cleaning, wrangling and analysis, pandas has become one of the go-to tools for data analysts. Built on NumPy, it provides high-performance, easy-to-use data structures and data analysis tools. In essence, its flexibility and versatility make it a critical part of the data analyst's toolkit, as it holds the capability to cater to virtually every data manipulation task.\n\nLearn more from the following resources:",
|
||||
"links": [
|
||||
{
|
||||
"title": "Pandas",
|
||||
"title": "Pandas Website",
|
||||
"url": "https://pandas.pydata.org/",
|
||||
"type": "article"
|
||||
},
|
||||
@@ -495,7 +473,7 @@
|
||||
},
|
||||
"l1SnPc4EMqGdaIAhIQfrT": {
|
||||
"title": "Data Visualisation Libraries",
|
||||
"description": "Data visualization libraries are crucial in data science for transforming complex datasets into clear and interpretable visual representations, facilitating better understanding and communication of data insights. In Python, several libraries are widely used for this purpose. Matplotlib is a foundational library that offers comprehensive tools for creating static, animated, and interactive plots. Seaborn, built on top of Matplotlib, provides a high-level interface for drawing attractive and informative statistical graphics with minimal code. Plotly is another powerful library that allows for the creation of interactive and dynamic visualizations, which can be easily embedded in web applications. Additionally, libraries like Bokeh and Altair offer capabilities for creating interactive plots and dashboards, enhancing exploratory data analysis and the presentation of data findings. Together, these libraries enable data scientists to effectively visualize trends, patterns, and outliers in their data, making the analysis more accessible and actionable.\n\nLearn more from the following resources:",
|
||||
"description": "Data visualization libraries are crucial in data science for transforming complex datasets into clear and interpretable visual representations, facilitating better understanding and communication of data insights. In Python, several libraries are widely used for this purpose. Matplotlib is a foundational library that offers comprehensive tools for creating static, animated, and interactive plots. Seaborn, built on top of Matplotlib, provides a high-level interface for drawing attractive and informative statistical graphics with minimal code. Plotly is another powerful library that allows for the creation of interactive and dynamic visualizations, which can be easily embedded in web applications. Additionally, libraries like Bokeh and Altair offer capabilities for creating interactive plots and dashboards, enhancing exploratory data analysis and the presentation of data findings. Together, these libraries enable data scientists to effectively visualize trends, patterns, and outliers in their data, making the analysis more accessible and actionable.",
|
||||
"links": []
|
||||
},
|
||||
"uGkXxdMXUMY-3fQFS1jK8": {
|
||||
@@ -503,7 +481,7 @@
|
||||
"description": "Matplotlib is a paramount data visualization library used extensively by data analysts for generating a wide array of plots and graphs. Through Matplotlib, data analysts can convey results clearly and effectively, driving insights from complex data sets. It offers a hierarchical environment which is very natural for a data scientist to work with. Providing an object-oriented API, it allows for extensive customization and integration into larger applications. From histograms, bar charts, scatter plots to 3D graphs, the versatility of Matplotlib assists data analysts in the better comprehension and compelling representation of data.\n\nLearn more from the following resources:",
|
||||
"links": [
|
||||
{
|
||||
"title": "Matplotlib",
|
||||
"title": "Matplotlib Website",
|
||||
"url": "https://matplotlib.org/",
|
||||
"type": "article"
|
||||
},
|
||||
@@ -519,7 +497,7 @@
|
||||
"description": "Dplyr is a powerful and popular toolkit for data manipulation in R. As a data analyst, this library provides integral functions to manipulate, clean, and process data efficiently. It has been designed to be easy and intuitive, ensuring a robust and consistent syntax. Dplyr ensures data reliability and fast processing, essential for analysts dealing with large datasets. With a strong focus on efficiency, dplyr functions like select, filter, arrange, mutate, summarise, and group\\_by optimise data analysis operations, making data manipulation a smoother and hassle-free procedure for data analysts.\n\nLearn more from the following resources:",
|
||||
"links": [
|
||||
{
|
||||
"title": "dplyr",
|
||||
"title": "dplyr website",
|
||||
"url": "https://dplyr.tidyverse.org/",
|
||||
"type": "article"
|
||||
},
|
||||
@@ -535,7 +513,7 @@
|
||||
"description": "When it comes to data visualization in R programming, ggplot2 stands tall as one of the primary tools for data analysts. This data visualization library, which forms part of the tidyverse suite of packages, facilitates the creation of complex and sophisticated visual narratives. With its grammar of graphics philosophy, ggplot2 enables analysts to build graphs and charts layer by layer, thereby offering detailed control over graphical features and design. Its versatility in creating tailored and aesthetically pleasing graphics is a vital asset for any data analyst tackling exploratory data analysis, reporting, or dashboard building.\n\nLearn more from the following resources:",
|
||||
"links": [
|
||||
{
|
||||
"title": "ggplot2",
|
||||
"title": "ggplot2 website",
|
||||
"url": "https://ggplot2.tidyverse.org/",
|
||||
"type": "article"
|
||||
},
|
||||
@@ -548,27 +526,21 @@
|
||||
},
|
||||
"_sjXCLHHTbZromJYn6fnu": {
|
||||
"title": "Data Collection",
|
||||
"description": "Data collection is a foundational process that entails gathering relevant data from various sources. This data can be quantitative or qualitative and may be sourced from databases, online platforms, customer feedback, among others. The gathered information is then cleaned, processed, and interpreted to extract meaningful insights. A data analyst performs this whole process carefully, as the quality of data is paramount to ensuring accurate analysis, which in turn informs business decisions and strategies. This highlights the importance of an excellent understanding, proper tools, and precise techniques when it comes to data collection in data analysis.\n\nLearn more from the following resources:",
|
||||
"links": [
|
||||
{
|
||||
"title": "Data Collection",
|
||||
"url": "https://en.wikipedia.org/wiki/Data_collection",
|
||||
"type": "article"
|
||||
}
|
||||
]
|
||||
"description": "In the context of the Data Analyst role, data collection is a foundational process that entails gathering relevant data from various sources. This data can be quantitative or qualitative and may be sourced from databases, online platforms, customer feedback, among others. The gathered information is then cleaned, processed, and interpreted to extract meaningful insights. A data analyst performs this whole process carefully, as the quality of data is paramount to ensuring accurate analysis, which in turn informs business decisions and strategies. This highlights the importance of an excellent understanding, proper tools, and precise techniques when it comes to data collection in data analysis.",
|
||||
"links": []
|
||||
},
|
||||
"tYPeLCxbqvMFlTkCGjdHg": {
|
||||
"title": "Databases",
|
||||
"description": "Behind every strong data analyst, there's not just a rich assortment of data, but a set of robust databases that enable effective data collection. Databases are a fundamental aspect of data collection in a world where the capability to manage, organize, and evaluate large volumes of data is critical. As a data analyst, the understanding and use of databases is instrumental in capturing the necessary data for conducting qualitative and quantitative analysis, forecasting trends and making data-driven decisions. Thorough knowledge of databases, therefore, can be considered a key component of a data analyst's arsenal. These databases can vary from relational databases like SQL to NoSQL databases like MongoDB, each serving a unique role in the data collection process.\n\nLearn more from the following resources:",
|
||||
"links": [
|
||||
{
|
||||
"title": "Visit Dedicated SQL Roadmap",
|
||||
"url": "https://roadmap.sh/sql",
|
||||
"title": "PostgreSQL Roadmap",
|
||||
"url": "https://roadmap.sh/postgresql-dba",
|
||||
"type": "article"
|
||||
},
|
||||
{
|
||||
"title": "Visit Dedicated PostgreSQL Roadmap",
|
||||
"url": "https://roadmap.sh/postgresql-dba",
|
||||
"title": "MongoDB Roadmap",
|
||||
"url": "https://roadmap.sh/mongodb",
|
||||
"type": "article"
|
||||
}
|
||||
]
|
||||
@@ -599,7 +571,7 @@
|
||||
"type": "article"
|
||||
},
|
||||
{
|
||||
"title": "A Beginner's Guide to APIs",
|
||||
"title": "A beginners guide to APIs",
|
||||
"url": "https://www.postman.com/what-is-an-api/",
|
||||
"type": "article"
|
||||
}
|
||||
@@ -610,12 +582,12 @@
|
||||
"description": "Web scraping plays a significant role in collecting unique datasets for data analysis. In the realm of a data analyst's tasks, web scraping refers to the method of extracting information from websites and converting it into a structured usable format like a CSV, Excel spreadsheet, or even into databases. This technique allows data analysts to gather large sets of data from the internet, which otherwise could be time-consuming if done manually. The capability of web scraping and parsing data effectively can give data analysts a competitive edge in their data analysis process, from unlocking in-depth, insightful information to making data-driven decisions.\n\nLearn more from the following resources:",
|
||||
"links": [
|
||||
{
|
||||
"title": "What is Web Scraping & What is it used for?",
|
||||
"title": "What is web scraping what is it used for?",
|
||||
"url": "https://www.parsehub.com/blog/what-is-web-scraping/",
|
||||
"type": "article"
|
||||
},
|
||||
{
|
||||
"title": "What is Web Scraping?",
|
||||
"title": "What is web scraping?",
|
||||
"url": "https://www.youtube.com/watch?v=dlj_QL-ENJM",
|
||||
"type": "video"
|
||||
}
|
||||
@@ -623,14 +595,8 @@
|
||||
},
|
||||
"E6cpb6kvluJM8OGuDcFBT": {
|
||||
"title": "Data Cleanup",
|
||||
"description": "Data cleaning, which is often referred as data cleansing or data scrubbing, is one of the most important and initial steps in the data analysis process. As a data analyst, the bulk of your work often revolves around understanding, cleaning, and standardizing raw data before analysis. Data cleaning involves identifying, correcting or removing any errors or inconsistencies in datasets in order to improve their quality. The process is crucial because it directly determines the accuracy of the insights you generate - garbage in, garbage out. Even the most sophisticated models and visualizations would not be of much use if they're based on dirty data. Therefore, mastering data cleaning techniques is essential for any data analyst.\n\nLearn more from the following resources:",
|
||||
"links": [
|
||||
{
|
||||
"title": "Data Cleaning",
|
||||
"url": "https://www.tableau.com/learn/articles/what-is-data-cleaning#:~:text=tools%20and%20software-,What%20is%20data%20cleaning%3F,to%20be%20duplicated%20or%20mislabeled.",
|
||||
"type": "article"
|
||||
}
|
||||
]
|
||||
"description": "Data cleaning, which is often referred as data cleansing or data scrubbing, is one of the most important and initial steps in the data analysis process. As a data analyst, the bulk of your work often revolves around understanding, cleaning, and standardizing raw data before analysis. Data cleaning involves identifying, correcting or removing any errors or inconsistencies in datasets in order to improve their quality. The process is crucial because it directly determines the accuracy of the insights you generate - garbage in, garbage out. Even the most sophisticated models and visualizations would not be of much use if they're based on dirty data. Therefore, mastering data cleaning techniques is essential for any data analyst.",
|
||||
"links": []
|
||||
},
|
||||
"X9WmfHOks82BIAzs6abqO": {
|
||||
"title": "Handling Missing Data",
|
||||
@@ -670,14 +636,14 @@
|
||||
"links": [
|
||||
{
|
||||
"title": "Outliers",
|
||||
"url": "https://www.mathsisfun.com/data/outliers.html",
|
||||
"url": "%5Bhttps://www.mathsisfun.com/data/outliers.html",
|
||||
"type": "article"
|
||||
}
|
||||
]
|
||||
},
|
||||
"t_BRtEharsrOZxoyX0OzV": {
|
||||
"title": "Data Transformation",
|
||||
"description": "Data Transformation, also known as Data Wrangling, is an essential part of a Data Analyst's role. This process involves the conversion of data from a raw format into another format to make it more appropriate and valuable for a variety of downstream purposes such as analytics. Data Analysts transform data to make the data more suitable for analysis, ensure accuracy, and to improve data quality. The right transformation techniques can give the data a structure, multiply its value, and enhance the accuracy of the analytics performed by serving meaningful results.\n\nLearn more from the following resources:",
|
||||
"description": "Data Transformation, also known as Data Wrangling, is an essential part of a Data Analyst's role. This process involves the conversion of data from a raw format into another format to make it more appropriate and valuable for a variety of downstream purposes such as analytics. Data Analysts transform data to make the data more suitable for analysis, ensure accuracy, and to improve data quality. The right transformation techniques can give the data a structure, multiply its value, and enhance the accuracy of the analytics performed by serving meaningful results.",
|
||||
"links": [
|
||||
{
|
||||
"title": "What is data transformation?",
|
||||
@@ -696,7 +662,7 @@
|
||||
"description": "In the realms of data analysis, data cleaning is a crucial preliminary process, this is where `pandas` - a popular python library - shines. Primarily used for data manipulation and analysis, pandas adopts a flexible and powerful data structure (DataFrames and Series) that greatly simplifies the process of cleaning raw, messy datasets. Data analysts often work with large volumes of data, some of which may contain missing or inconsistent data that can negatively impact the results of their analysis. By utilizing pandas, data analysts can quickly identify, manage and fill these missing values, drop unnecessary columns, rename column headings, filter specific data, apply functions for more complex data transformations and much more. Thus, making pandas an invaluable tool for effective data cleaning in data analysis.\n\nLearn more from the following resources:",
|
||||
"links": [
|
||||
{
|
||||
"title": "Pandas",
|
||||
"title": "Pandas Website",
|
||||
"url": "https://pandas.pydata.org/",
|
||||
"type": "article"
|
||||
},
|
||||
@@ -712,7 +678,7 @@
|
||||
"description": "Data cleaning plays a crucial role in the data analysis pipeline, where it rectifies and enhances the quality of data to increase the efficiency and authenticity of the analytical process. The `dplyr` package, an integral part of the `tidyverse` suite in R, has become a staple in the toolkit of data analysts dealing with data cleaning. `dplyr` offers a coherent set of verbs that significantly simplifies the process of manipulating data structures, such as dataframes and databases. This involves selecting, sorting, filtering, creating or modifying variables, and aggregating records, among other operations. Incorporating `dplyr` into the data cleaning phase enables data analysts to perform operations more effectively, improve code readability, and handle large and complex data with ease.\n\nLearn more from the following resources:",
|
||||
"links": [
|
||||
{
|
||||
"title": "dplyr",
|
||||
"title": "dplyr website",
|
||||
"url": "https://dplyr.tidyverse.org/",
|
||||
"type": "article"
|
||||
},
|
||||
@@ -824,7 +790,7 @@
|
||||
"description": "When focusing on data analysis, understanding key statistical concepts is crucial. Amongst these, central tendency is a foundational element. Central Tendency refers to the measure that determines the center of a distribution. The average is a commonly used statistical tool by which data analysts discern trends and patterns. As one of the most recognized forms of central tendency, figuring out the \"average\" involves summing all values in a data set and dividing by the number of values. This provides analysts with a 'typical' value, around which the remaining data tends to cluster, facilitating better decision-making based on existing data.\n\nLearn more from the following resources:",
|
||||
"links": [
|
||||
{
|
||||
"title": "How to Calculate the Average",
|
||||
"title": "How to calculate the average",
|
||||
"url": "https://support.microsoft.com/en-gb/office/calculate-the-average-of-a-group-of-numbers-e158ef61-421c-4839-8290-34d7b1e68283#:~:text=Average%20This%20is%20the%20arithmetic,by%206%2C%20which%20is%205.",
|
||||
"type": "article"
|
||||
},
|
||||
@@ -840,7 +806,7 @@
|
||||
"description": "The concept of Range refers to the spread of a dataset, primarily in the realm of statistics and data analysis. This measure is crucial for a data analyst as it provides an understanding of the variability amongst the numbers within a dataset. Specifically in a role such as Data Analyst, understanding the range and dispersion aids in making more precise analyses and predictions. Understanding the dispersion within a range can highlight anomalies, identify standard norms, and form the foundation for statistical conclusions like the standard deviation, variance, and interquartile range. It allows for the comprehension of the reliability and stability of particular datasets, which can help guide strategic decisions in many industries. Therefore, range is a key concept that every data analyst must master.\n\nLearn more from the following resources:",
|
||||
"links": [
|
||||
{
|
||||
"title": "How to Find the Range of a Data Set",
|
||||
"title": "How to find the range of a data set",
|
||||
"url": "https://www.scribbr.co.uk/stats/range-statistics/",
|
||||
"type": "article"
|
||||
}
|
||||
@@ -851,12 +817,12 @@
|
||||
"description": "Data analysts heavily rely on statistical concepts to analyze and interpret data, and one such fundamental concept is variance. Variance, an essential measure of dispersion, quantifies the spread of data, providing insight into the level of variability within the dataset. Understanding variance is crucial for data analysts as the reliability of many statistical models depends on the assumption of constant variance across observations. In other words, it helps analysts determine how much data points diverge from the expected value or mean, which can be pivotal in identifying outliers, understanding data distribution, and driving decision-making processes. However, variance can't be interpreted in the original units of measurement due to its squared nature, which is why it is often used in conjunction with its square root, the standard deviation.\n\nLearn more from the following resources:",
|
||||
"links": [
|
||||
{
|
||||
"title": "What is Variance?",
|
||||
"title": "What is variance?",
|
||||
"url": "https://www.investopedia.com/terms/v/variance.asp",
|
||||
"type": "article"
|
||||
},
|
||||
{
|
||||
"title": "How to Calculate Variance",
|
||||
"title": "How to calculate variance",
|
||||
"url": "https://www.scribbr.co.uk/stats/variance-meaning/",
|
||||
"type": "article"
|
||||
}
|
||||
@@ -926,7 +892,7 @@
|
||||
"description": "Tableau is a powerful data visualization tool utilized extensively by data analysts worldwide. Its primary role is to transform raw, unprocessed data into an understandable format without any technical skills or coding. Data analysts use Tableau to create data visualizations, reports, and dashboards that help businesses make more informed, data-driven decisions. They also use it to perform tasks like trend analysis, pattern identification, and forecasts, all within a user-friendly interface. Moreover, Tableau's data visualization capabilities make it easier for stakeholders to understand complex data and act on insights quickly.\n\nLearn more from the following resources:",
|
||||
"links": [
|
||||
{
|
||||
"title": "Tableau",
|
||||
"title": "Tableau Website",
|
||||
"url": "https://www.tableau.com/en-gb",
|
||||
"type": "article"
|
||||
},
|
||||
@@ -942,7 +908,7 @@
|
||||
"description": "PowerBI, an interactive data visualization and business analytics tool developed by Microsoft, plays a crucial role in the field of a data analyst's work. It helps data analysts to convert raw data into meaningful insights through it's easy-to-use dashboards and reports function. This tool provides a unified view of business data, allowing analysts to track and visualize key performance metrics and make better-informed business decisions. With PowerBI, data analysts also have the ability to manipulate and produce visualizations of large data sets that can be shared across an organization, making complex statistical information more digestible.\n\nLearn more from the following resources:",
|
||||
"links": [
|
||||
{
|
||||
"title": "Power BI",
|
||||
"title": "Power BI Website",
|
||||
"url": "https://www.microsoft.com/en-us/power-platform/products/power-bi",
|
||||
"type": "article"
|
||||
},
|
||||
@@ -958,7 +924,7 @@
|
||||
"description": "For a Data Analyst, understanding data and being able to represent it in a visually insightful form is a crucial part of effective decision-making in any organization. Matplotlib, a plotting library for the Python programming language, is an extremely useful tool for this purpose. It presents a versatile framework for generating line plots, scatter plots, histogram, bar charts and much more in a very straightforward manner. This library also allows for comprehensive customizations, offering a high level of control over the look and feel of the graphics it produces, which ultimately enhances the quality of data interpretation and communication.\n\nLearn more from the following resources:",
|
||||
"links": [
|
||||
{
|
||||
"title": "Matplotlib",
|
||||
"title": "Matplotlib Website",
|
||||
"url": "https://matplotlib.org/",
|
||||
"type": "article"
|
||||
},
|
||||
@@ -974,7 +940,7 @@
|
||||
"description": "Seaborn is a robust, comprehensive Python library focused on the creation of informative and attractive statistical graphics. As a data analyst, seaborn plays an essential role in elaborating complex visual stories with the data. It aids in understanding the data by providing an interface for drawing attractive and informative statistical graphics. Seaborn is built on top of Python's core visualization library Matplotlib, and is integrated with data structures from Pandas. This makes seaborn an integral tool for data visualization in the data analyst's toolkit, making the exploration and understanding of data easier and more intuitive.\n\nLearn more from the following resources:",
|
||||
"links": [
|
||||
{
|
||||
"title": "Seaborn",
|
||||
"title": "Seaborn Website",
|
||||
"url": "https://seaborn.pydata.org/",
|
||||
"type": "article"
|
||||
},
|
||||
@@ -1006,12 +972,12 @@
|
||||
"description": "As a vital tool in the data analyst's arsenal, bar charts are essential for analyzing and interpreting complex data. Bar charts, otherwise known as bar graphs, are frequently used graphical displays for dealing with categorical data groups or discrete variables. With their stark visual contrast and definitive measurements, they provide a simple yet effective means of identifying trends, understanding data distribution, and making data-driven decisions. By analyzing the lengths or heights of different bars, data analysts can effectively compare categories or variables against each other and derive meaningful insights effectively. Simplicity, readability, and easy interpretation are key features that make bar charts a favorite in the world of data analytics.\n\nLearn more from the following resources:",
|
||||
"links": [
|
||||
{
|
||||
"title": "A Complete Guide to Bar Charts",
|
||||
"title": "A complete guide to bar charts",
|
||||
"url": "https://www.atlassian.com/data/charts/bar-chart-complete-guide",
|
||||
"type": "article"
|
||||
},
|
||||
{
|
||||
"title": "What is a Bar Chart?",
|
||||
"title": "What is a bar chart?",
|
||||
"url": "https://www.youtube.com/watch?v=WTVdncVCvKo",
|
||||
"type": "video"
|
||||
}
|
||||
@@ -1038,7 +1004,7 @@
|
||||
"description": "A scatter plot, a crucial aspect of data visualization, is a mathematical diagram using Cartesian coordinates to represent values from two different variables. As a data analyst, understanding and interpreting scatter plots can be instrumental in identifying correlations and trends within a dataset, drawing meaningful insights, and showcasing these findings in a clear, visual manner. In addition, scatter plots are paramount in predictive analytics as they reveal patterns which can be used to predict future occurrences.\n\nLearn more from the following resources:",
|
||||
"links": [
|
||||
{
|
||||
"title": "Mastering Scatter Plots",
|
||||
"title": "Mastering scatter plots",
|
||||
"url": "https://www.atlassian.com/data/charts/what-is-a-scatter-plot",
|
||||
"type": "article"
|
||||
},
|
||||
@@ -1086,7 +1052,7 @@
|
||||
"description": "A stacked chart is an essential tool for a data analyst in the field of data visualization. This type of chart presents quantitative data in a visually appealing manner and allows users to easily compare different categories while still being able to compare the total sizes. These charts are highly effective when trying to measure part-to-whole relationships, displaying accumulated totals over time or when presenting data with multiple variables. Data analysts often use stacked charts to detect patterns, trends and anomalies which can aid in strategic decision making.\n\nLearn more from the following resources:",
|
||||
"links": [
|
||||
{
|
||||
"title": "What is a Stacked Chart?",
|
||||
"title": "What is a stacked chart?",
|
||||
"url": "https://www.spotfire.com/glossary/what-is-a-stacked-chart",
|
||||
"type": "article"
|
||||
},
|
||||
@@ -1102,12 +1068,12 @@
|
||||
"description": "Heatmaps are a crucial component of data visualization that Data Analysts regularly employ in their analyses. As one of many possible graphical representations of data, heatmaps show the correlation or scale of variation between two or more variables in a dataset, making them extremely useful for pattern recognition and outlier detection. Individual values within a matrix are represented in a heatmap as colors, with differing intensities indicating the degree or strength of an occurrence. In short, a Data Analyst would use a heatmap to decode complex multivariate data and turn it into an easily understandable visual that aids in decision making.\n\nLearn more from the following resources:",
|
||||
"links": [
|
||||
{
|
||||
"title": "A Complete Guide to Heatmaps",
|
||||
"title": "A complete guide to heatmaps",
|
||||
"url": "https://www.hotjar.com/heatmaps/",
|
||||
"type": "article"
|
||||
},
|
||||
{
|
||||
"title": "What is a Heatmap?",
|
||||
"title": "What is a heatmap?",
|
||||
"url": "https://www.atlassian.com/data/charts/heatmap-complete-guide",
|
||||
"type": "article"
|
||||
}
|
||||
@@ -1118,12 +1084,12 @@
|
||||
"description": "As a data analyst, understanding and efficiently using various forms of data visualization is crucial. Among these, Pie Charts represent a significant tool. Essentially, pie charts are circular statistical graphics divided into slices to illustrate numerical proportions. Each slice of the pie corresponds to a particular category. The pie chart's beauty lies in its simplicity and visual appeal, making it an effective way to convey relative proportions or percentages at a glance. For a data analyst, it's particularly useful when you want to show a simple distribution of categorical data. Like any tool, though, it's important to use pie charts wisely—ideally, when your data set has fewer than seven categories, and the proportions between categories are distinct.\n\nLearn more from the following resources:",
|
||||
"links": [
|
||||
{
|
||||
"title": "A Complete Guide to Pie Charts",
|
||||
"title": "A complete guide to pie charts",
|
||||
"url": "https://www.atlassian.com/data/charts/pie-chart-complete-guide",
|
||||
"type": "article"
|
||||
},
|
||||
{
|
||||
"title": "What is a Pie Chart",
|
||||
"title": "What is a a pie chart",
|
||||
"url": "https://www.youtube.com/watch?v=GjJdZaQrItg",
|
||||
"type": "video"
|
||||
}
|
||||
@@ -1131,30 +1097,13 @@
|
||||
},
|
||||
"2g19zjEASJw2ve57hxpr0": {
|
||||
"title": "Data Visualisation",
|
||||
"description": "Data Visualization is a fundamental fragment of the responsibilities of a data analyst. It involves the presentation of data in a graphical or pictorial format which allows decision-makers to see analytics visually. This practice can help them comprehend difficult concepts or establish new patterns. With interactive visualization, data analysts can take the data analysis process to a whole new level — drill down into charts and graphs for more detail, and interactively changing what data is presented or how it’s processed. Thereby it forms a crucial link in the chain of converting raw data to actionable insights which is one of the primary roles of a Data Analyst.\n\nLearn more from the following resources:",
|
||||
"links": [
|
||||
{
|
||||
"title": "What is Data Visualization?",
|
||||
"url": "https://www.ibm.com/think/topics/data-visualization",
|
||||
"type": "article"
|
||||
}
|
||||
]
|
||||
"description": "Data Visualization is a fundamental fragment of the responsibilities of a data analyst. It involves the presentation of data in a graphical or pictorial format which allows decision-makers to see analytics visually. This practice can help them comprehend difficult concepts or establish new patterns. With interactive visualization, data analysts can take the data analysis process to a whole new level — drill down into charts and graphs for more detail, and interactively changing what data is presented or how it’s processed. Thereby it forms a crucial link in the chain of converting raw data to actionable insights which is one of the primary roles of a Data Analyst.",
|
||||
"links": []
|
||||
},
|
||||
"TeewVruErSsD4VLXcaDxp": {
|
||||
"title": "Statistical Analysis",
|
||||
"description": "Statistical analysis is a core component of a data analyst's toolkit. As professionals dealing with vast amount of structured and unstructured data, data analysts often turn to statistical methods to extract insights and make informed decisions. The role of statistical analysis in data analytics involves gathering, reviewing, and interpreting data for various applications, enabling businesses to understand their performance, trends, and growth potential. Data analysts use a range of statistical techniques from modeling, machine learning, and data mining, to convey vital information that supports strategic company actions.\n\nLearn more from the following resources:",
|
||||
"links": [
|
||||
{
|
||||
"title": "Understanding Statistical Analysis",
|
||||
"url": "https://www.simplilearn.com/what-is-statistical-analysis-article",
|
||||
"type": "article"
|
||||
},
|
||||
{
|
||||
"title": "Statistical Analysis",
|
||||
"url": "https://www.youtube.com/watch?v=XjMBZE1DuBY",
|
||||
"type": "video"
|
||||
}
|
||||
]
|
||||
"links": []
|
||||
},
|
||||
"Xygwu0m5TeYT6S_8FKKXh": {
|
||||
"title": "Hypothesis Testing",
|
||||
@@ -1206,7 +1155,7 @@
|
||||
},
|
||||
"mCUW07rx74_dUNi7OGVlj": {
|
||||
"title": "Visualizing Distributions",
|
||||
"description": "Visualising Distributions, from a data analyst's perspective, plays a key role in understanding the overall distribution and identifying patterns within data. It aids in summarizing, structuring, and plotting structured data graphically to provide essential insights. This includes using different chart types like bar graphs, histograms, and scatter plots for interval data, and pie or bar graphs for categorical data. Ultimately, the aim is to provide a straightforward and effective manner to comprehend the data's characteristics and underlying structure. A data analyst uses these visualisation techniques to make initial conclusions, detect anomalies, and decide on further analysis paths.\n\nLearn more from the following resources:",
|
||||
"description": "Visualising Distributions, from a data analyst's perspective, plays a key role in understanding the overall distribution and identifying patterns within data. It aids in summarising, structuring, and plotting structured data graphically to provide essential insights. This includes using different chart types like bar graphs, histograms, and scatter plots for interval data, and pie or bar graphs for categorical data. Ultimately, the aim is to provide a straightforward and effective manner to comprehend the data's characteristics and underlying structure. A data analyst uses these visualisation techniques to make initial conclusions, detect anomalies, and decide on further analysis paths.\n\nLearn more from the following resources:",
|
||||
"links": [
|
||||
{
|
||||
"title": "Data Visualizations that Capture Distributions",
|
||||
@@ -1246,12 +1195,12 @@
|
||||
"description": "Unsupervised learning, as a fundamental aspect of Machine Learning, holds great implications in the realm of data analytics. It is an approach where a model learns to identify patterns and relationships within a dataset that isn't labelled or classified. It is especially useful for a Data Analyst as it can assist in recognizing unforeseen trends, providing new insights or preparing data for other machine learning tasks. This ability to infer without direct supervision allows a vast potential for latent structure discovery and new knowledge derivation from raw data.\n\nLearn more from the following resources:",
|
||||
"links": [
|
||||
{
|
||||
"title": "What is Unsupervised Learning?",
|
||||
"title": "What is unsupervised learning?",
|
||||
"url": "https://cloud.google.com/discover/what-is-unsupervised-learning",
|
||||
"type": "article"
|
||||
},
|
||||
{
|
||||
"title": "Introduction to Unsupervised Learning",
|
||||
"title": "Introduction to unsupervised learning",
|
||||
"url": "https://www.datacamp.com/blog/introduction-to-unsupervised-learning",
|
||||
"type": "article"
|
||||
}
|
||||
@@ -1262,7 +1211,7 @@
|
||||
"description": "Supervised machine learning forms an integral part of the toolset for a Data Analyst. With a direct focus on building predictive models from labeled datasets, it involves training an algorithm based on these known inputs and outputs, helping Data Analysts establish correlations and make reliable predictions. Fortifying a Data Analyst's role, supervised machine learning enables the accurate interpretation of complex data, enhancing decision-making processes.\n\nLearn more from the following resources:",
|
||||
"links": [
|
||||
{
|
||||
"title": "What is Supervised Learning?",
|
||||
"title": "What is supervised learning?",
|
||||
"url": "https://cloud.google.com/discover/what-is-supervised-learning",
|
||||
"type": "article"
|
||||
},
|
||||
@@ -1326,12 +1275,12 @@
|
||||
"description": "As a data analyst, it's crucial to understand various model evaluation techniques. These techniques involve different methods to measure the performance or accuracy of machine learning models. For instance, using confusion matrix, precision, recall, F1 score, ROC curves or Root Mean Squared Error (RMSE) among others. Knowing how to apply these techniques effectively not only helps in selecting the best model for a specific problem but also guides in tuning the performance of the models for optimal results. Understanding these model evaluation techniques also allows data analysts to interpret evaluation results and determine the effectiveness and applicability of a model.\n\nLearn more from the following resources:",
|
||||
"links": [
|
||||
{
|
||||
"title": "What is Model Evaluation",
|
||||
"title": "What is model evaluation",
|
||||
"url": "https://domino.ai/data-science-dictionary/model-evaluation",
|
||||
"type": "article"
|
||||
},
|
||||
{
|
||||
"title": "Model Evaluation Metrics",
|
||||
"title": "Model evaluation metrics",
|
||||
"url": "https://www.markovml.com/blog/model-evaluation-metrics",
|
||||
"type": "article"
|
||||
}
|
||||
@@ -1339,14 +1288,8 @@
|
||||
},
|
||||
"_aUQZWUhFRvNu0MZ8CPit": {
|
||||
"title": "Big Data Technologies",
|
||||
"description": "In the modern digitized world, Big Data refers to extremely large datasets that are challenging to manage and analyze using traditional data processing applications. These datasets often come from numerous different sources and are not only voluminous but also diverse in nature, including structured and unstructured data. The role of a data analyst in the context of big data is crucial. Data analysts are responsible for inspecting, cleaning, transforming, and modeling big data to discover useful information, conclude and support decision-making. They leverage their analytical skills and various big data tools and technologies to extract insights that can benefit the organization and drive strategic business initiatives.\n\nLearn more from the following resources:",
|
||||
"links": [
|
||||
{
|
||||
"title": "Big Data Analytics",
|
||||
"url": "https://www.ibm.com/think/topics/big-data-analytics",
|
||||
"type": "article"
|
||||
}
|
||||
]
|
||||
"description": "In the modern digitized world, Big Data refers to extremely large datasets that are challenging to manage and analyze using traditional data processing applications. These datasets often come from numerous different sources and are not only voluminous but also diverse in nature, including structured and unstructured data. The role of a data analyst in the context of big data is crucial. Data analysts are responsible for inspecting, cleaning, transforming, and modeling big data to discover useful information, conclude and support decision-making. They leverage their analytical skills and various big data tools and technologies to extract insights that can benefit the organization and drive strategic business initiatives.",
|
||||
"links": []
|
||||
},
|
||||
"m1IfG2sEedUxMXrv_B8GW": {
|
||||
"title": "Big Data Concepts",
|
||||
@@ -1417,7 +1360,7 @@
|
||||
"description": "Hadoop is a critical element in the realm of data processing frameworks, offering an effective solution for storing, managing, and analyzing massive amounts of data. Unraveling meaningful insights from a large deluge of data is a challenging pursuit faced by many data analysts. Regular data processing tools fail to handle large-scale data, paving the way for advanced frameworks like Hadoop. This open-source platform by Apache Software Foundation excels at storing and processing vast data across clusters of computers. Notably, Hadoop comprises two key modules - the Hadoop Distributed File System (HDFS) for storage and MapReduce for processing. Hadoop’s ability to handle both structured and unstructured data further broadens its capacity. For any data analyst, a thorough understanding of Hadoop can unlock powerful ways to manage data effectively and construct meaningful analytics.\n\nLearn more from the following resources:",
|
||||
"links": [
|
||||
{
|
||||
"title": "Apache Hadoop",
|
||||
"title": "Apache Hadoop Website",
|
||||
"url": "https://hadoop.apache.org/",
|
||||
"type": "article"
|
||||
},
|
||||
@@ -1438,7 +1381,7 @@
|
||||
"type": "opensource"
|
||||
},
|
||||
{
|
||||
"title": "Apache Spark",
|
||||
"title": "Apache Spark Website",
|
||||
"url": "https://spark.apache.org/",
|
||||
"type": "article"
|
||||
}
|
||||
@@ -1478,21 +1421,15 @@
|
||||
},
|
||||
"SiYUdtYMDImRPmV2_XPkH": {
|
||||
"title": "Deep Learning (Optional)",
|
||||
"description": "Deep learning, a subset of machine learning technique, is increasingly becoming a critical tool for data analysts. Deep learning algorithms utilize multiple layers of neural networks to understand and interpret intricate structures in large data, a skill that is integral to the daily functions of a data analyst. With the ability to learn from unstructured or unlabeled data, deep learning opens a whole new range of possibilities for data analysts in terms of data processing, prediction, and categorization. It has applications in a variety of industries from healthcare to finance to e-commerce and beyond. A deeper understanding of deep learning methodologies can augment a data analyst's capability to evaluate and interpret complex datasets and provide valuable insights for decision making.\n\nLearn more from the following resources:",
|
||||
"links": [
|
||||
{
|
||||
"title": "Deep Learning for Data Analysis",
|
||||
"url": "https://www.ibm.com/think/topics/deep-learning",
|
||||
"type": "article"
|
||||
}
|
||||
]
|
||||
"description": "Deep learning, a subset of machine learning technique, is increasingly becoming a critical tool for data analysts. Deep learning algorithms utilize multiple layers of neural networks to understand and interpret intricate structures in large data, a skill that is integral to the daily functions of a data analyst. With the ability to learn from unstructured or unlabeled data, deep learning opens a whole new range of possibilities for data analysts in terms of data processing, prediction, and categorization. It has applications in a variety of industries from healthcare to finance to e-commerce and beyond. A deeper understanding of deep learning methodologies can augment a data analyst's capability to evaluate and interpret complex datasets and provide valuable insights for decision making.",
|
||||
"links": []
|
||||
},
|
||||
"gGHsKcS92StK5FolzmVvm": {
|
||||
"title": "Neural Networks",
|
||||
"description": "Neural Networks play a pivotal role in the landscape of deep learning, offering a plethora of benefits and applications for data analysts. They are computational models that emulate the way human brain processes information, enabling machines to make intelligent decisions. As a data analyst, understanding and utilizing neural networks can greatly enhance decision-making process as it allows to quickly and effectively analyze large datasets, recognize patterns, and forecast future trends. In deep learning, these networks are used for creating advanced models that can tackle complex tasks such as image recognition, natural language processing, and speech recognition, to name but a few. Therefore, an in-depth knowledge of neural networks is a significant asset for any aspiring or professional data analyst.\n\nLearn more from the following resources:",
|
||||
"links": [
|
||||
{
|
||||
"title": "What is a Neural Network?",
|
||||
"title": "What is a neural network?",
|
||||
"url": "https://aws.amazon.com/what-is/neural-network/",
|
||||
"type": "article"
|
||||
},
|
||||
@@ -1524,12 +1461,12 @@
|
||||
"description": "Recurrent Neural Networks(RNNs) are a type of Artificial Neural Networks(ANNs) which introduces us to the realm of Deep Learning, an aspect that has been significantly contributing to the evolution of Data Analysis. RNNs are specifically designed to recognize patterns in sequences of data, such as text, genomes, handwriting, or the spoken word. This inherent feature of RNNs makes them extremely useful and versatile for a data analyst.\n\nA data analyst leveraging RNNs can effectively charter the intrinsic complexity of data sequences, classify them, and make accurate predictions. With the fundamental understanding of deep learning, data analysts can unlock the full potential of RNNs in delivering insightful data analysis that goes beyond traditional statistical methods. Modern research and applications of RNNs extend to multiple domains including natural language processing, speech recognition, and even in the financial sphere for stock price prediction making this a key tool in a data analyst’s arsenal.\n\nLearn more from the following resources:",
|
||||
"links": [
|
||||
{
|
||||
"title": "What is a Recurrent Neural Network (RNN)?",
|
||||
"title": "What is a recurrent neural network (RNN)?",
|
||||
"url": "https://www.ibm.com/topics/recurrent-neural-networks",
|
||||
"type": "article"
|
||||
},
|
||||
{
|
||||
"title": "Recurrent Neural Networks Cheat-sheet",
|
||||
"title": "Recurrent Neural Networks cheatsheet",
|
||||
"url": "https://stanford.edu/~shervine/teaching/cs-230/cheatsheet-recurrent-neural-networks",
|
||||
"type": "article"
|
||||
}
|
||||
@@ -1540,15 +1477,10 @@
|
||||
"description": "TensorFlow, developed by Google Brain Team, has become a crucial tool in the realm of data analytics, particularly within the field of deep learning. It's an open-source platform for machine learning, offering a comprehensive and flexible ecosystem of tools, libraries, and community resources. As a data analyst, understanding and implementing TensorFlow for deep learning models allows us to identify complex patterns and make insightful predictions which standard analysis could miss. It's in-demand skill that enhances our ability to generate accurate insights from colossal and complicated structured or unstructured data sets.\n\nLearn more from the following resources:",
|
||||
"links": [
|
||||
{
|
||||
"title": "Tensorflow",
|
||||
"title": "Tensorflow Website",
|
||||
"url": "https://www.tensorflow.org/",
|
||||
"type": "article"
|
||||
},
|
||||
{
|
||||
"title": "Tensorflow Documentation",
|
||||
"url": "https://www.tensorflow.org/learn",
|
||||
"type": "article"
|
||||
},
|
||||
{
|
||||
"title": "Tensorflow in 100 seconds",
|
||||
"url": "https://www.youtube.com/watch?v=i8NETqtGHms",
|
||||
@@ -1561,15 +1493,10 @@
|
||||
"description": "PyTorch, an open-source machine learning library, has gained considerable popularity among data analysts due to its simplicity and high performance in tasks such as natural language processing and artificial intelligence. Specifically, in the domain of deep learning, PyTorch stands out due to its dynamic computational graph, allowing for a highly intuitive and flexible platform for building complex models. For data analysts, mastering PyTorch can open up a broad range of opportunities for data model development, data processing, and integration of machine learning algorithms.\n\nLearn more from the following resources:",
|
||||
"links": [
|
||||
{
|
||||
"title": "PyTorch",
|
||||
"title": "PyTorch Website",
|
||||
"url": "https://pytorch.org/",
|
||||
"type": "article"
|
||||
},
|
||||
{
|
||||
"title": "PyTorch Documentation",
|
||||
"url": "https://pytorch.org/docs/stable/index.html",
|
||||
"type": "article"
|
||||
},
|
||||
{
|
||||
"title": "PyTorch in 100 seconds",
|
||||
"url": "https://www.youtube.com/watch?v=ORMx45xqWkA",
|
||||
@@ -1582,7 +1509,7 @@
|
||||
"description": "Image Recognition has become a significant domain because of its diverse applications, including facial recognition, object detection, character recognition, and much more. As a Data Analyst, understanding Image Recognition under Deep Learning becomes crucial. The data analyst's role in this context involves deciphering complex patterns and extracting valuable information from image data. This area of machine learning combines knowledge of data analysis, image processing, and deep neural networks to provide accurate results, contributing significantly to the progression of fields like autonomous vehicles, medical imaging, surveillance, among others. Therefore, proficiency in this field paves the way for proficient data analysis, leading to innovative solutions and improved decision-making.\n\nLearn more from the following resources:",
|
||||
"links": [
|
||||
{
|
||||
"title": "What is Image Recognition?",
|
||||
"title": "What is image recognition?",
|
||||
"url": "https://www.techtarget.com/searchenterpriseai/definition/image-recognition",
|
||||
"type": "article"
|
||||
},
|
||||
@@ -1614,12 +1541,12 @@
|
||||
"description": "As a business enterprise expands, so does its data. For data analysts, the surge in information means they need efficient and scalable data storage solutions to manage vast volumes of structured and unstructured data, collectively referred to as Big Data. Big Data storage solutions are critical in preserving the integrity of data while also providing quick and easy access to the data when needed. These solutions use software and hardware components to securely store massive amounts of information across numerous servers, allowing data analysts to perform robust data extraction, data processing and complex data analyses. There are several options, from the traditional Relational Database Management Systems (RDBMS) to the more recent NoSQL databases, Hadoop ecosystems, and Cloud storage solutions, each offering unique capabilities and benefits to cater for different big data needs.\n\nLearn more from the following resources:",
|
||||
"links": [
|
||||
{
|
||||
"title": "Visit Dedicated SQL Roadmap",
|
||||
"title": "SQL Roadmap",
|
||||
"url": "https://roadmap.sh/sql",
|
||||
"type": "article"
|
||||
},
|
||||
{
|
||||
"title": "Visit Dedicated PostgreSQL Roadmap",
|
||||
"title": "PostgreSQL Roadmap",
|
||||
"url": "https://roadmap.sh/postgresql-dba",
|
||||
"type": "article"
|
||||
}
|
||||
|
||||
@@ -3027,13 +3027,13 @@
|
||||
"description": "Originally created at Lyft, Envoy is a high-performance data plane designed for service mesh architectures. Lyft open sourced it and donated it to the CNCF, where it is now one of the CNCF’s graduated open source projects. Envoy is a self contained process that is designed to run alongside every application server. All of the Envoys form a transparent communication mesh in which each application sends and receives messages to and from localhost and is unaware of the network topology.\n\nVisit the following resources to learn more:",
|
||||
"links": [
|
||||
{
|
||||
"title": "envoyproxy/envoy",
|
||||
"url": "https://github.com/envoyproxy/envoy",
|
||||
"type": "opensource"
|
||||
"title": "Envoy Website",
|
||||
"url": "https://www.envoyproxy.io/",
|
||||
"type": "article"
|
||||
},
|
||||
{
|
||||
"title": "Envoy",
|
||||
"url": "https://www.envoyproxy.io/",
|
||||
"title": "envoyproxy/envoy",
|
||||
"url": "https://github.com/envoyproxy/envoy",
|
||||
"type": "article"
|
||||
},
|
||||
{
|
||||
|
||||
@@ -170,11 +170,6 @@
|
||||
"title": "HTML",
|
||||
"description": "HTML (Hypertext Markup Language) is the standard markup language used to create web pages and web applications. It provides a structure for content on the World Wide Web, using a system of elements and attributes to define the layout and content of a document. HTML elements are represented by tags, which browsers interpret to render the visual and auditory elements of a web page. The language has evolved through several versions, with HTML5 being the current standard, introducing semantic elements, improved multimedia support, and enhanced form controls. HTML works in conjunction with CSS for styling and JavaScript for interactivity, forming the foundation of modern web development.\n\nVisit the following resources to learn more:",
|
||||
"links": [
|
||||
{
|
||||
"title": "Responsive Web Design Certification - Co-Learn HTML & CSS with guided projects",
|
||||
"url": "https://www.freecodecamp.org/learn/2022/responsive-web-design/",
|
||||
"type": "course"
|
||||
},
|
||||
{
|
||||
"title": "W3Schools: Learn HTML",
|
||||
"url": "https://www.w3schools.com/html/html_intro.asp",
|
||||
@@ -326,11 +321,6 @@
|
||||
"url": "https://www.youtube.com/watch?v=G3e-cpL7ofc",
|
||||
"type": "course"
|
||||
},
|
||||
{
|
||||
"title": "Responsive Web Design Certification - Co-Learn HTML & CSS with guided projects",
|
||||
"url": "https://www.freecodecamp.org/learn/2022/responsive-web-design/",
|
||||
"type": "course"
|
||||
},
|
||||
{
|
||||
"title": "Web.dev by Google — Learn CSS",
|
||||
"url": "https://web.dev/learn/css/",
|
||||
|
||||
@@ -599,16 +599,16 @@
|
||||
},
|
||||
"vWLKYK2KUzV1fO-vQunzW": {
|
||||
"title": "EPA",
|
||||
"description": "The **EPA** (Expanding Polytope Algorithm) is an iterative algorithm used for calculating the penetration depth between two shapes in collision detection. It is commonly used in physics engines and robotics. The algorithm takes the resulting simplex from a previously applied GJK algorithm, iteratively expanding the polytope towards the Minkowski Difference boundary until it finds the closest point to the origin. The vector from that point to the origin is the penetration vector and its magnitude is equal to the penetration depth between the two shapes.\n\nVisit the following resources to learn more:",
|
||||
"description": "The **EPA**, also known as the _Environmental Protection Agency_, is not typically related to game development or the concept of intersection within this context. However, in game development, EPA might refer to an 'Event-driven Process chain Architecture' or some other game-specific acronym. In this domain, different terminologies and acronyms are often used to express complex architectures, designs, or functionalities. If you have encountered EPA in a game development context, it might be best to refer to the specific documentation or guide where it was described for a better understanding. Understanding the context is key to untangle the meaning of such abbreviations.\n\nVisit the following resources to learn more:",
|
||||
"links": [
|
||||
{
|
||||
"title": "EPA: Collision response algorithm for 2D/3D - winter.dev",
|
||||
"url": "https://winter.dev/articles/epa-algorithm",
|
||||
"title": "Environmental Sustainability in Game Development",
|
||||
"url": "https://polydin.com/environmental-sustainability-in-game-development/",
|
||||
"type": "article"
|
||||
},
|
||||
{
|
||||
"title": "EPA (Expanding Polytope Algorithm) - dyn4j",
|
||||
"url": "https://dyn4j.org/2010/05/epa-expanding-polytope-algorithm/",
|
||||
"title": "Gaming Sustainability - Microsoft Game Dev",
|
||||
"url": "https://learn.microsoft.com/en-us/gaming/sustainability/sustainability-overview",
|
||||
"type": "article"
|
||||
}
|
||||
]
|
||||
|
||||
@@ -1023,16 +1023,16 @@
|
||||
},
|
||||
"XteNExIZN3_g95_dPCopY": {
|
||||
"title": "Exitting / Exit Codes",
|
||||
"description": "Exiting is a way of terminating a Node.js process by using node.js process module.\n\nVisit the following resources to learn more:",
|
||||
"description": "`Exiting` is a way of terminating a Node.js process by using node.js process module.\n\nVisit the following resources to learn more:",
|
||||
"links": [
|
||||
{
|
||||
"title": "Exit Documentation",
|
||||
"url": "https://nodejs.org/api/process.html#event-exit",
|
||||
"title": "Node.js Docs on exit",
|
||||
"url": "https://nodejs.org/docs/latest/api/process.html",
|
||||
"type": "article"
|
||||
},
|
||||
{
|
||||
"title": "How to Exit a Process in Node.js",
|
||||
"url": "https://betterstack.com/community/questions/how-to-exit-in-node-js/",
|
||||
"url": "https://www.knowledgehut.com/blog/web-development/node-js-process-exit",
|
||||
"type": "article"
|
||||
}
|
||||
]
|
||||
|
||||
@@ -319,13 +319,8 @@
|
||||
"description": "The Null Safe Operator is a handy feature in PHP which deals with an issue that often pops up when working with objects: trying to access properties or methods on an object that might be null. Instead of a fatal error, the PHP Null Safe Operator (indicated by ?->) allows null values to be returned safely, making your code more robust. Here's a quick example, consider $session?->user?->name. If $session or user is null, PHP will stop further execution and simply return null. This makes PHP more resilient when processing unpredictable data.\n\nVisit the following resources to learn more:",
|
||||
"links": [
|
||||
{
|
||||
"title": "The Basics - Manual",
|
||||
"url": "https://www.php.net/manual/en/language.oop5.basic.php",
|
||||
"type": "article"
|
||||
},
|
||||
{
|
||||
"title": "PHP RFC: Nullsafe operator",
|
||||
"url": "https://wiki.php.net/rfc/nullsafe_operator",
|
||||
"title": "Null Safe Operator",
|
||||
"url": "https://www.php.net/manual/en/language.oop5.nullsafe.php",
|
||||
"type": "article"
|
||||
}
|
||||
]
|
||||
@@ -398,7 +393,7 @@
|
||||
},
|
||||
"RkNjYva8o_jXp9suz5YdG": {
|
||||
"title": "Named Arguments",
|
||||
"description": "Named arguments in PHP, introduced with PHP 8.0, allow you to specify the values of required parameters by their names, instead of their position in the function call, thus making your code more readable, reducing mistakes, and allowing for unimportant arguments to be skipped. Here's an array\\_fill() function using named arguments:\n\n <?php\n $a = array_fill(start_index: 0, count: 100, value: 50);\n \n\nIn this code snippet, the parameters are passed by their names ('start\\_index', 'count', 'value'), not by their order in the function definition.\n\nVisit the following resources to learn more:",
|
||||
"description": "Named arguments in PHP, introduced with PHP 8.0, allow you to specify the values of required parameters by their names, instead of their position in the function call, thus making your code more readable, reducing mistakes, and allowing for unimportant arguments to be skipped. Here's an array\\_fill() function using named arguments:\n\n <?php\n $a = array_fill(start_index: 0, num: 100, value: 50);\n \n\nIn this code snippet, the parameters are passed by their names ('start\\_index', 'num', 'value'), not by their order in the function definition.\n\nVisit the following resources to learn more:",
|
||||
"links": [
|
||||
{
|
||||
"title": "Named Arguments",
|
||||
@@ -717,8 +712,14 @@
|
||||
},
|
||||
"J9yIXZTtwbFzH2u4dI1ep": {
|
||||
"title": "CSRF Protection",
|
||||
"description": "Cross-Site Request Forgery (CSRF) Protection in PHP is a method where a website can defend itself against unwanted actions performed on behalf of the users without their consent. It's a critical aspect of security as it safeguards users against potential harmful activities. Here's an example: if users are logged into a website and get tricked into clicking a deceitful link, CSRF attacks could be triggered. To protect your PHP applications from such attacks, you can generate a unique token for every session and include it as a hidden field for all form submissions. Afterwards, you need to verify this token on the server side before performing any action.\n\n <?php\n // Generate CSRF token\n if(empty($_SESSION['csrf'])) {\n $_SESSION['csrf'] = bin2hex(random_bytes(32));\n }\n \n // Verify CSRF token\n if(isset($_POST['csrf']) && $_POST['csrf'] === $_SESSION['csrf']) {\n // valid CSRF token, perform action\n }\n ?>\n \n\nVisit the following resources to learn more:\n\n* \\[@article@PHP Tutorial CSRF\\] ([https://www.phptutorial.net/php-tutorial/php-csrf/](https://www.phptutorial.net/php-tutorial/php-csrf/))",
|
||||
"links": []
|
||||
"description": "Cross-Site Request Forgery (CSRF) Protection in PHP is a method where a website can defend itself against unwanted actions performed on behalf of the users without their consent. It's a critical aspect of security as it safeguards users against potential harmful activities. Here's an example: if users are logged into a website and get tricked into clicking a deceitful link, CSRF attacks could be triggered. To protect your PHP applications from such attacks, you can generate a unique token for every session and include it as a hidden field for all form submissions. Afterwards, you need to verify this token on the server side before performing any action.\n\n <?php\n // Generate CSRF token\n if(empty($_SESSION['csrf'])) {\n $_SESSION['csrf'] = bin2hex(random_bytes(32));\n }\n \n // Verify CSRF token\n if(isset($_POST['csrf']) && $_POST['csrf'] === $_SESSION['csrf']) {\n // valid CSRF token, perform action\n }\n ?>\n \n\nVisit the following resources to learn more:",
|
||||
"links": [
|
||||
{
|
||||
"title": "Security Guide",
|
||||
"url": "https://php.net/manual/en/security.csrf.php",
|
||||
"type": "article"
|
||||
}
|
||||
]
|
||||
},
|
||||
"JbWFfJiCRrXDhnuIx_lqx": {
|
||||
"title": "Password Hashing",
|
||||
@@ -1020,12 +1021,12 @@
|
||||
"description": "Symfony is a set of PHP components and a framework for web projects. It aims to speed up the creation and maintenance of web applications and replace the recurring coding tasks. Symfony uses Composer, a PHP dependency manager, to manage its components. Below is an example of creating a new Symfony project:\n\n composer create-project symfony/website-skeleton myproject\n \n\nThis will download and install a new Symfony project in the 'myproject' directory. Symfony's components are reusable PHP libraries that will help you complete tasks, like routing, templating, or even creating form handling.\n\nVisit the following resources to learn more:",
|
||||
"links": [
|
||||
{
|
||||
"title": "Symfony",
|
||||
"title": "Symphony",
|
||||
"url": "https://symfony.com/",
|
||||
"type": "article"
|
||||
},
|
||||
{
|
||||
"title": "Symfony Documentation",
|
||||
"title": "Symphony Documentation",
|
||||
"url": "https://symfony.com/doc/current/index.html",
|
||||
"type": "article"
|
||||
}
|
||||
|
||||
@@ -583,7 +583,7 @@
|
||||
"links": [
|
||||
{
|
||||
"title": "pg_ctlcluster",
|
||||
"url": "https://manpages.ubuntu.com/manpages/focal/man1/pg_ctlcluster.1.html",
|
||||
"url": "https://www.postgresql.org/docs/current/pgctlcluster.html",
|
||||
"type": "article"
|
||||
}
|
||||
]
|
||||
@@ -1075,7 +1075,7 @@
|
||||
]
|
||||
},
|
||||
"S20aJB-VuSpXYyd0-0S8c": {
|
||||
"title": "Object Privileges",
|
||||
"title": "Object Priviliges",
|
||||
"description": "Object privileges in PostgreSQL are the permissions given to different user roles to access or modify database objects like tables, views, sequences, and functions. Ensuring proper object privileges is crucial for maintaining a secure and well-functioning database.\n\nLearn more from the following resources:",
|
||||
"links": [
|
||||
{
|
||||
@@ -1117,7 +1117,7 @@
|
||||
]
|
||||
},
|
||||
"t18XjeHP4uRyERdqhHpl5": {
|
||||
"title": "Default Privileges",
|
||||
"title": "Default Priviliges",
|
||||
"description": "PostgreSQL allows you to define object privileges for various types of database objects. These privileges determine if a user can access and manipulate objects like tables, views, sequences, or functions. In this section, we will focus on understanding default privileges in PostgreSQL.\n\nLearn more from the following resources:",
|
||||
"links": [
|
||||
{
|
||||
|
||||
@@ -399,19 +399,8 @@
|
||||
},
|
||||
"gS3ofDrqDRKbecIskIyGi": {
|
||||
"title": "Product Roadmap",
|
||||
"description": "The product roadmap is a strategic document that provides a detailed overview of the product's direction and vision. It outlines the product's plans, both tactical and strategic - including the specific steps necessary to achieve the company's goals and vision. As a Product Manager, you are expected to guide the creation of the product roadmap, communicating the product’s evolution to the team, stakeholders, and customers. This tool serves as an essential reference point helping to align all stakeholders with the key priorities and vision of the product, and acts as a guide for decisions around product development.\n\nLearn more from the following resources:",
|
||||
"links": [
|
||||
{
|
||||
"title": "What is a Product Roadmap? - Product Plan",
|
||||
"url": "https://www.productplan.com/learn/what-is-a-product-roadmap/",
|
||||
"type": "article"
|
||||
},
|
||||
{
|
||||
"title": "What is a Product Roadmap? - Vibhor Chandel",
|
||||
"url": "https://www.youtube.com/watch?v=BJR70jnpHog&ab_channel=VibhorChandel",
|
||||
"type": "video"
|
||||
}
|
||||
]
|
||||
"description": "The product roadmap is a strategic document that provides a detailed overview of the product's direction and vision. It outlines the product's plans, both tactical and strategic - including the specific steps necessary to achieve the company's goals and vision. As a Product Manager, you are expected to guide the creation of the product roadmap, communicating the product’s evolution to the team, stakeholders, and customers. This tool serves as an essential reference point helping to align all stakeholders with the key priorities and vision of the product, and acts as a guide for decisions around product development.",
|
||||
"links": []
|
||||
},
|
||||
"eiqV86PWizZPWsyqoBU5k": {
|
||||
"title": "Creating a Roadmap",
|
||||
|
||||
@@ -179,21 +179,6 @@
|
||||
"title": "Tuples Documentation",
|
||||
"url": "https://docs.python.org/3/tutorial/datastructures.html#tuples-and-sequences",
|
||||
"type": "article"
|
||||
},
|
||||
{
|
||||
"title": "When and How to Use Tuples",
|
||||
"url": "https://thenewstack.io/python-for-beginners-when-and-how-to-use-tuples/",
|
||||
"type": "article"
|
||||
},
|
||||
{
|
||||
"title": "Python's tuple Data Type: A Deep Dive With Examples",
|
||||
"url": "https://realpython.com/python-tuple/#getting-started-with-pythons-tuple-data-type",
|
||||
"type": "article"
|
||||
},
|
||||
{
|
||||
"title": "why are Tuples even a thing?",
|
||||
"url": "https://www.youtube.com/watch?v=fR_D_KIAYrE",
|
||||
"type": "video"
|
||||
}
|
||||
]
|
||||
},
|
||||
@@ -220,7 +205,7 @@
|
||||
},
|
||||
"bc9CL_HMT-R6nXO1eR-gP": {
|
||||
"title": "Dictionaries",
|
||||
"description": "In Python, a dictionary is a built-in data type that allows you to store key-value pairs. Each key in the dictionary is unique, and each key is associated with a value. Starting from Python 3.7, dictionaries maintain the order of items as they were added.\n\nLearn more from the following resources:",
|
||||
"description": "In Python, a dictionary is a built-in data type that allows you to store key-value pairs. Each key in the dictionary is unique, and each key is associated with a value. Dictionaries are unordered collections, meaning the order of items is not guaranteed.\n\nLearn more from the following resources:",
|
||||
"links": [
|
||||
{
|
||||
"title": "Dictionaries in Python",
|
||||
@@ -231,11 +216,6 @@
|
||||
"title": "W3 Schools - Dictionaries",
|
||||
"url": "https://www.w3schools.com/python/python_dictionaries.asp",
|
||||
"type": "article"
|
||||
},
|
||||
{
|
||||
"title": "Dictionaries in Python",
|
||||
"url": "https://realpython.com/python-dicts/",
|
||||
"type": "article"
|
||||
}
|
||||
]
|
||||
},
|
||||
@@ -553,11 +533,6 @@
|
||||
"title": "Modules in Python",
|
||||
"url": "https://www.programiz.com/python-programming/modules",
|
||||
"type": "article"
|
||||
},
|
||||
{
|
||||
"title": "Python Modules and Packages",
|
||||
"url": "https://realpython.com/python-modules-packages/",
|
||||
"type": "article"
|
||||
}
|
||||
]
|
||||
},
|
||||
@@ -621,11 +596,6 @@
|
||||
"title": "Python Iterators",
|
||||
"url": "https://www.programiz.com/python-programming/iterator",
|
||||
"type": "article"
|
||||
},
|
||||
{
|
||||
"title": "Iterators and Iterables in Python",
|
||||
"url": "https://realpython.com/python-iterators-iterables/",
|
||||
"type": "article"
|
||||
}
|
||||
]
|
||||
},
|
||||
|
||||
@@ -534,7 +534,7 @@
|
||||
"links": [
|
||||
{
|
||||
"title": "RPOP Documentation",
|
||||
"url": "https://redis.io/docs/latest/commands/rpop/",
|
||||
"url": "https://redis.io/docs/latest/commands/rpush/",
|
||||
"type": "article"
|
||||
}
|
||||
]
|
||||
@@ -954,19 +954,8 @@
|
||||
},
|
||||
"jrgaoDnt_RxTu79hk4hCD": {
|
||||
"title": "Atomicity in Redis",
|
||||
"description": "Atomicity in Redis refers to the property that ensures a set of operations is executed as a single, indivisible unit. This means that either all the operations are executed successfully or none of them are. Atomicity is crucial in Redis to maintain consistency, especially when multiple operations need to be performed together.\n\nLearn more from the following resources:",
|
||||
"links": [
|
||||
{
|
||||
"title": "Atomicity with Lua",
|
||||
"url": "https://redis.io/learn/develop/java/spring/rate-limiting/fixed-window/reactive-lua",
|
||||
"type": "article"
|
||||
},
|
||||
{
|
||||
"title": "Atomicity in Redis operations",
|
||||
"url": "https://lucaspin.medium.com/atomicity-in-redis-operations-a1d7bc9f4a90",
|
||||
"type": "article"
|
||||
}
|
||||
]
|
||||
"description": "Atomicity in Redis refers to the property that ensures a set of operations is executed as a single, indivisible unit. This means that either all the operations are executed successfully or none of them are. Atomicity is crucial in Redis to maintain consistency, especially when multiple operations need to be performed together.\n\nLearn more from the following resources:\n\n* [@official@Atomicity with Lua](https://redis.io/learn/develop/java/spring/rate-limiting/fixed-window/reactive-lua) -[@article@Atomicity in Redis operations](https://lucaspin.medium.com/atomicity-in-redis-operations-a1d7bc9f4a90)",
|
||||
"links": []
|
||||
},
|
||||
"LHlwjN3WHYUBUafzzwsWQ": {
|
||||
"title": "Pipelining",
|
||||
|
||||
@@ -496,7 +496,7 @@
|
||||
},
|
||||
"_U0VoTkqM1d6NR13p5azS": {
|
||||
"title": "Patterns & Design Principles",
|
||||
"description": "In the realm of software architecture, patterns and design principles are foundational tools that enable architects to create robust, scalable, and maintainable systems. They offer proven solutions to common problems and guide decision-making throughout the software development lifecycle. Understanding these concepts is essential for anyone following a software architect roadmap, as they bridge the gap between high-level architecture and practical implementation.",
|
||||
"description": "",
|
||||
"links": []
|
||||
},
|
||||
"AMDLJ_Bup-AY1chl_taV3": {
|
||||
|
||||
@@ -557,11 +557,11 @@
|
||||
},
|
||||
"fY8zgbB13wxZ1CFtMSdZZ": {
|
||||
"title": "SQL Tuning",
|
||||
"description": "SQL tuning is the attempt to diagnose and repair SQL statements that fail to meet a performance standard. It is a broad topic and many books have been written as reference. It's important to benchmark and profile to simulate and uncover bottlenecks.\n\n* Benchmark - Simulate high-load situations with tools such as ab.\n* Profile - Enable tools such as the slow query log to help track performance issues.\n\nBenchmarking and profiling might point you to the following optimizations.\n\nTo learn more, visit the following links:",
|
||||
"description": "SQL tuning is a broad topic and many books have been written as reference. It's important to benchmark and profile to simulate and uncover bottlenecks.\n\n* Benchmark - Simulate high-load situations with tools such as ab.\n* Profile - Enable tools such as the slow query log to help track performance issues.\n\nBenchmarking and profiling might point you to the following optimizations.\n\nTo learn more, visit the following links:",
|
||||
"links": [
|
||||
{
|
||||
"title": "Introduction to SQL Tuning - Oracle",
|
||||
"url": "https://docs.oracle.com/en/database/oracle/oracle-database/23/tgsql/introduction-to-sql-tuning.html#GUID-B653E5F3-F078-4BBC-9516-B892960046A2",
|
||||
"title": "Optimizing MySQL Queries",
|
||||
"url": "https://aiddroid.com/10-tips-optimizing-mysql-queries-dont-suck/",
|
||||
"type": "article"
|
||||
},
|
||||
{
|
||||
@@ -1665,21 +1665,10 @@
|
||||
}
|
||||
]
|
||||
},
|
||||
"n4It-lr7FFtSY83DcGydX": {
|
||||
"backends-for-frontend@n4It-lr7FFtSY83DcGydX.md": {
|
||||
"title": "Backends for Frontend",
|
||||
"description": "Create separate backend services to be consumed by specific frontend applications or interfaces. This pattern is useful when you want to avoid customizing a single backend for multiple interfaces. This pattern was first described by Sam Newman.\n\nTo learn more, visit the following links:",
|
||||
"links": [
|
||||
{
|
||||
"title": "Backends for Frontends pattern",
|
||||
"url": "https://learn.microsoft.com/en-us/azure/architecture/patterns/backends-for-frontends",
|
||||
"type": "article"
|
||||
},
|
||||
{
|
||||
"title": "Explore top posts about Frontend Development",
|
||||
"url": "https://app.daily.dev/tags/frontend?ref=roadmapsh",
|
||||
"type": "article"
|
||||
}
|
||||
]
|
||||
"description": "",
|
||||
"links": []
|
||||
},
|
||||
"4hi7LvjLcv8eR6m-uk8XQ": {
|
||||
"title": "Anti-Corruption Layer",
|
||||
|
||||
@@ -387,14 +387,8 @@
|
||||
},
|
||||
"90_M5qABC1vZ1nsXVyqFJ": {
|
||||
"title": "Good Layout Rules",
|
||||
"description": "In the world of UX design, a good layout is crucial to ensure your prototype is intuitive and user-friendly. By following these good layout rules, you can ensure your designs are efficient, attractive, and easy to navigate for users.\n\nConsistency\n-----------\n\nBeing consistent with your design is vital in creating an easy-to-navigate interface. Utilize the same color schemes, typography, and other design elements consistently throughout your prototype to make it visually cohesive and user-friendly.\n\nAlignment and Spacing\n---------------------\n\nEnsure all the elements on your prototype are aligned and spaced properly. This helps create a well-structured and clean look, while also making it easy for users to navigate and understand your design.\n\nVisual Hierarchy\n----------------\n\nEstablish clear visual hierarchy by using size, color, contrast, and white space effectively. This helps users identify important elements on the screen quickly and understand the flow of your design easily.\n\nGrouping of Elements\n--------------------\n\nGroup related elements together, such as navigation menus or form input fields. This helps users recognize the purpose and function of each section more quickly and intuitively.\n\nBalance and Proportion\n----------------------\n\nCreate a balanced and proportional look by distributing elements on the screen evenly. This can be achieved through the use of grids or other layout techniques that help maintain a sense of harmony and order in your design.\n\nAccessibility\n-------------\n\nEnsure your design is accessible to all users by considering factors such as text size, contrast, and color combinations. Aim to create an inclusive prototype that caters to people of different abilities and preferences.\n\nResponsiveness and Flexibility\n------------------------------\n\nMake sure your prototype can adapt to different screen sizes and devices, ensuring a seamless user experience across various platforms. This is particularly important when designing for web and mobile applications.\n\nIterating and Testing\n---------------------\n\nAs you develop your design, continually test and iterate on your layout based on user feedback and data. This process will help refine your design and ensure it meets the needs and expectations of your users.\n\nBy incorporating these good layout rules into your prototyping process, you'll be well on your way to creating a user-friendly and effective design that meets the goals and objectives of your project.\n\nVisit the following resources to learn more:",
|
||||
"links": [
|
||||
{
|
||||
"title": "User Interface Design Guidelines: 10 Rules of Thumb",
|
||||
"url": "https://www.interaction-design.org/literature/article/user-interface-design-guidelines-10-rules-of-thumb",
|
||||
"type": "article"
|
||||
}
|
||||
]
|
||||
"description": "In the world of UX design, a good layout is crucial to ensure your prototype is intuitive and user-friendly. By following these good layout rules, you can ensure your designs are efficient, attractive, and easy to navigate for users.\n\nConsistency\n-----------\n\nBeing consistent with your design is vital in creating an easy-to-navigate interface. Utilize the same color schemes, typography, and other design elements consistently throughout your prototype to make it visually cohesive and user-friendly.\n\nAlignment and Spacing\n---------------------\n\nEnsure all the elements on your prototype are aligned and spaced properly. This helps create a well-structured and clean look, while also making it easy for users to navigate and understand your design.\n\nVisual Hierarchy\n----------------\n\nEstablish clear visual hierarchy by using size, color, contrast, and white space effectively. This helps users identify important elements on the screen quickly and understand the flow of your design easily.\n\nGrouping of Elements\n--------------------\n\nGroup related elements together, such as navigation menus or form input fields. This helps users recognize the purpose and function of each section more quickly and intuitively.\n\nBalance and Proportion\n----------------------\n\nCreate a balanced and proportional look by distributing elements on the screen evenly. This can be achieved through the use of grids or other layout techniques that help maintain a sense of harmony and order in your design.\n\nAccessibility\n-------------\n\nEnsure your design is accessible to all users by considering factors such as text size, contrast, and color combinations. Aim to create an inclusive prototype that caters to people of different abilities and preferences.\n\nResponsiveness and Flexibility\n------------------------------\n\nMake sure your prototype can adapt to different screen sizes and devices, ensuring a seamless user experience across various platforms. This is particularly important when designing for web and mobile applications.\n\nIterating and Testing\n---------------------\n\nAs you develop your design, continually test and iterate on your layout based on user feedback and data. This process will help refine your design and ensure it meets the needs and expectations of your users.\n\nBy incorporating these good layout rules into your prototyping process, you'll be well on your way to creating a user-friendly and effective design that meets the goals and objectives of your project.",
|
||||
"links": []
|
||||
},
|
||||
"t46s6Piyd8MoJYzdDTsjr": {
|
||||
"title": "Figma",
|
||||
|
||||
@@ -234,11 +234,6 @@
|
||||
"title": "Global Properties",
|
||||
"description": "Global properties allows you to add properties or methods that can be accessed throughout your application. This is particularly useful for sharing functionality or data across components without the need to pass props explicitly.\n\nVisit the following resources to learn more:",
|
||||
"links": [
|
||||
{
|
||||
"title": "Application API - globalProperties",
|
||||
"url": "https://vuejs.org/api/application.html#app-config-globalproperties",
|
||||
"type": "article"
|
||||
},
|
||||
{
|
||||
"title": "Vue.js Global Properties",
|
||||
"url": "https://blog.logrocket.com/vue-js-globalproperties/",
|
||||
@@ -549,7 +544,7 @@
|
||||
"links": [
|
||||
{
|
||||
"title": "Modifiers",
|
||||
"url": "https://vuejs.org/guide/essentials/forms.html#modifiers",
|
||||
"url": "https://v2.vuejs.org/v2/guide/components-custom-events.html",
|
||||
"type": "article"
|
||||
}
|
||||
]
|
||||
|
||||
@@ -86,6 +86,9 @@ export function AdvertiseForm() {
|
||||
|
||||
pageProgressMessage.set('Please wait');
|
||||
|
||||
// Placeholder function to send data
|
||||
console.log('Form data:', formData);
|
||||
|
||||
const { response, error } = await httpPost(
|
||||
`${import.meta.env.PUBLIC_API_URL}/v1-advertise`,
|
||||
formData,
|
||||
|
||||
@@ -6,7 +6,6 @@ declare global {
|
||||
category: string;
|
||||
label?: string;
|
||||
value?: string;
|
||||
callback?: () => void;
|
||||
}) => void;
|
||||
}
|
||||
}
|
||||
@@ -18,7 +17,7 @@ declare global {
|
||||
* @returns void
|
||||
*/
|
||||
window.fireEvent = (props) => {
|
||||
const { action, category, label, value, callback } = props;
|
||||
const { action, category, label, value } = props;
|
||||
if (!window.gtag) {
|
||||
console.warn('Missing GTAG - Analytics disabled');
|
||||
return;
|
||||
@@ -26,16 +25,11 @@ window.fireEvent = (props) => {
|
||||
|
||||
if (import.meta.env.DEV) {
|
||||
console.log('Analytics event fired', props);
|
||||
callback?.();
|
||||
return;
|
||||
}
|
||||
|
||||
window.gtag('event', action, {
|
||||
event_category: category,
|
||||
event_label: label,
|
||||
value: value,
|
||||
...(callback ? { event_callback: callback } : {}),
|
||||
});
|
||||
};
|
||||
|
||||
export {};
|
||||
|
||||
@@ -1,5 +1,6 @@
|
||||
---
|
||||
import { parse } from 'node-html-parser';
|
||||
import type { Attributes } from 'node-html-parser/dist/nodes/html';
|
||||
|
||||
export interface Props {
|
||||
icon: string;
|
||||
@@ -14,6 +15,7 @@ async function getSVG(name: string) {
|
||||
eager: true,
|
||||
});
|
||||
|
||||
|
||||
if (!(filepath in files)) {
|
||||
throw new Error(`${filepath} not found`);
|
||||
}
|
||||
|
||||
@@ -1,143 +0,0 @@
|
||||
import { useEffect, useState } from 'react';
|
||||
import { Modal } from '../Modal';
|
||||
import { GitHubButton } from './GitHubButton';
|
||||
import { GoogleButton } from './GoogleButton';
|
||||
import { LinkedInButton } from './LinkedInButton';
|
||||
import { EmailLoginForm } from './EmailLoginForm';
|
||||
import { EmailSignupForm } from './EmailSignupForm';
|
||||
|
||||
type CourseLoginPopupProps = {
|
||||
onClose: () => void;
|
||||
checkoutAfterLogin?: boolean;
|
||||
};
|
||||
|
||||
export const CHECKOUT_AFTER_LOGIN_KEY = 'checkoutAfterLogin';
|
||||
|
||||
export function CourseLoginPopup(props: CourseLoginPopupProps) {
|
||||
const { onClose: parentOnClose, checkoutAfterLogin = true } = props;
|
||||
|
||||
const [isDisabled, setIsDisabled] = useState(false);
|
||||
const [isUsingEmail, setIsUsingEmail] = useState(false);
|
||||
|
||||
const [emailNature, setEmailNature] = useState<'login' | 'signup' | null>(
|
||||
null,
|
||||
);
|
||||
|
||||
function onClose() {
|
||||
// if user didn't login and closed the popup, we remove the checkoutAfterLogin flag
|
||||
// so that login from other buttons on course page will trigger purchase
|
||||
localStorage.removeItem(CHECKOUT_AFTER_LOGIN_KEY);
|
||||
parentOnClose();
|
||||
}
|
||||
|
||||
useEffect(() => {
|
||||
localStorage.setItem(
|
||||
CHECKOUT_AFTER_LOGIN_KEY,
|
||||
checkoutAfterLogin ? '1' : '0',
|
||||
);
|
||||
}, [checkoutAfterLogin]);
|
||||
|
||||
if (emailNature) {
|
||||
const emailHeader = (
|
||||
<div className="mb-7 text-center">
|
||||
<p className="mb-3.5 pt-2 text-2xl font-semibold leading-5 text-slate-900">
|
||||
{emailNature === 'login'
|
||||
? 'Login to your account'
|
||||
: 'Create an account'}
|
||||
</p>
|
||||
<p className="mt-2 text-sm leading-4 text-slate-600">
|
||||
Fill in the details below to continue
|
||||
</p>
|
||||
</div>
|
||||
);
|
||||
|
||||
return (
|
||||
<Modal onClose={onClose} bodyClassName="p-5 h-auto">
|
||||
{emailHeader}
|
||||
{emailNature === 'login' && (
|
||||
<EmailLoginForm
|
||||
isDisabled={isDisabled}
|
||||
setIsDisabled={setIsDisabled}
|
||||
/>
|
||||
)}
|
||||
{emailNature === 'signup' && (
|
||||
<EmailSignupForm
|
||||
isDisabled={isDisabled}
|
||||
setIsDisabled={setIsDisabled}
|
||||
/>
|
||||
)}
|
||||
|
||||
<button
|
||||
className="mt-2 w-full rounded-md border border-gray-400 py-2 text-center text-sm text-gray-600 hover:bg-gray-100"
|
||||
onClick={() => setEmailNature(null)}
|
||||
>
|
||||
Back to Options
|
||||
</button>
|
||||
</Modal>
|
||||
);
|
||||
}
|
||||
|
||||
return (
|
||||
<Modal onClose={onClose} bodyClassName="p-5 h-auto">
|
||||
<div className="mb-7 text-center">
|
||||
<p className="mb-3.5 pt-2 text-2xl font-semibold leading-5 text-slate-900">
|
||||
Create or login to your account
|
||||
</p>
|
||||
<p className="mt-2 text-sm leading-4 text-slate-600">
|
||||
Login or sign up for an account to start learning
|
||||
</p>
|
||||
</div>
|
||||
|
||||
<div className="flex w-full flex-col gap-2">
|
||||
<GitHubButton
|
||||
className="rounded-md border-gray-400 hover:bg-gray-100"
|
||||
isDisabled={isDisabled}
|
||||
setIsDisabled={setIsDisabled}
|
||||
/>
|
||||
<GoogleButton
|
||||
className="rounded-md border-gray-400 hover:bg-gray-100"
|
||||
isDisabled={isDisabled}
|
||||
setIsDisabled={setIsDisabled}
|
||||
/>
|
||||
<LinkedInButton
|
||||
className="rounded-md border-gray-400 hover:bg-gray-100"
|
||||
isDisabled={isDisabled}
|
||||
setIsDisabled={setIsDisabled}
|
||||
/>
|
||||
</div>
|
||||
|
||||
<div className="flex w-full items-center gap-4 py-6 text-sm text-gray-600">
|
||||
<div className="h-px w-full bg-gray-200" />
|
||||
OR
|
||||
<div className="h-px w-full bg-gray-200" />
|
||||
</div>
|
||||
|
||||
<div className="flex flex-row gap-2">
|
||||
{!isUsingEmail && (
|
||||
<button
|
||||
className="flex-grow rounded-md border border-gray-400 px-4 py-2 text-sm text-gray-600 hover:bg-gray-100"
|
||||
onClick={() => setIsUsingEmail(true)}
|
||||
>
|
||||
Use your email address
|
||||
</button>
|
||||
)}
|
||||
{isUsingEmail && (
|
||||
<>
|
||||
<button
|
||||
className="flex-grow rounded-md border border-gray-400 px-4 py-2 text-sm text-gray-600 hover:bg-gray-100"
|
||||
onClick={() => setEmailNature('login')}
|
||||
>
|
||||
Already have an account
|
||||
</button>
|
||||
<button
|
||||
className="flex-grow rounded-md border border-gray-400 px-4 py-2 text-sm text-gray-600 hover:bg-gray-100"
|
||||
onClick={() => setEmailNature('signup')}
|
||||
>
|
||||
Create an account
|
||||
</button>
|
||||
</>
|
||||
)}
|
||||
</div>
|
||||
</Modal>
|
||||
);
|
||||
}
|
||||
@@ -2,7 +2,7 @@ import Cookies from 'js-cookie';
|
||||
import type { FormEvent } from 'react';
|
||||
import { useId, useState } from 'react';
|
||||
import { httpPost } from '../../lib/http';
|
||||
import { FIRST_LOGIN_PARAM, setAuthToken } from '../../lib/jwt';
|
||||
import { TOKEN_COOKIE_NAME, setAuthToken } from '../../lib/jwt';
|
||||
|
||||
type EmailLoginFormProps = {
|
||||
isDisabled?: boolean;
|
||||
@@ -24,22 +24,19 @@ export function EmailLoginForm(props: EmailLoginFormProps) {
|
||||
setIsDisabled?.(true);
|
||||
setError('');
|
||||
|
||||
const { response, error } = await httpPost<{
|
||||
token: string;
|
||||
isNewUser: boolean;
|
||||
}>(`${import.meta.env.PUBLIC_API_URL}/v1-login`, {
|
||||
email,
|
||||
password,
|
||||
});
|
||||
const { response, error } = await httpPost<{ token: string }>(
|
||||
`${import.meta.env.PUBLIC_API_URL}/v1-login`,
|
||||
{
|
||||
email,
|
||||
password,
|
||||
},
|
||||
);
|
||||
|
||||
// Log the user in and reload the page
|
||||
if (response?.token) {
|
||||
setAuthToken(response.token);
|
||||
window.location.reload();
|
||||
|
||||
const currentLocation = window.location.href;
|
||||
const url = new URL(currentLocation, window.location.origin);
|
||||
url.searchParams.set(FIRST_LOGIN_PARAM, response?.isNewUser ? '1' : '0');
|
||||
window.location.href = url.toString();
|
||||
return;
|
||||
}
|
||||
|
||||
|
||||
@@ -1,27 +1,21 @@
|
||||
import { useEffect, useState } from 'react';
|
||||
import { GitHubIcon } from '../ReactIcons/GitHubIcon.tsx';
|
||||
import {
|
||||
FIRST_LOGIN_PARAM,
|
||||
COURSE_PURCHASE_PARAM,
|
||||
setAuthToken,
|
||||
} from '../../lib/jwt';
|
||||
import { cn } from '../../../editor/utils/classname.ts';
|
||||
import Cookies from 'js-cookie';
|
||||
import { TOKEN_COOKIE_NAME, setAuthToken } from '../../lib/jwt';
|
||||
import { httpGet } from '../../lib/http';
|
||||
import { Spinner } from '../ReactIcons/Spinner.tsx';
|
||||
import { CHECKOUT_AFTER_LOGIN_KEY } from './CourseLoginPopup.tsx';
|
||||
import { triggerUtmRegistration } from '../../lib/browser.ts';
|
||||
|
||||
type GitHubButtonProps = {
|
||||
isDisabled?: boolean;
|
||||
setIsDisabled?: (isDisabled: boolean) => void;
|
||||
className?: string;
|
||||
};
|
||||
|
||||
const GITHUB_REDIRECT_AT = 'githubRedirectAt';
|
||||
const GITHUB_LAST_PAGE = 'githubLastPage';
|
||||
|
||||
export function GitHubButton(props: GitHubButtonProps) {
|
||||
const { isDisabled, setIsDisabled, className } = props;
|
||||
const { isDisabled, setIsDisabled } = props;
|
||||
|
||||
const [isLoading, setIsLoading] = useState(false);
|
||||
const [error, setError] = useState('');
|
||||
@@ -38,7 +32,7 @@ export function GitHubButton(props: GitHubButtonProps) {
|
||||
|
||||
setIsLoading(true);
|
||||
setIsDisabled?.(true);
|
||||
httpGet<{ token: string; isNewUser: boolean }>(
|
||||
httpGet<{ token: string }>(
|
||||
`${import.meta.env.PUBLIC_API_URL}/v1-github-callback${
|
||||
window.location.search
|
||||
}`,
|
||||
@@ -55,7 +49,7 @@ export function GitHubButton(props: GitHubButtonProps) {
|
||||
|
||||
triggerUtmRegistration();
|
||||
|
||||
let redirectUrl = new URL('/', window.location.origin);
|
||||
let redirectUrl = '/';
|
||||
const gitHubRedirectAt = localStorage.getItem(GITHUB_REDIRECT_AT);
|
||||
const lastPageBeforeGithub = localStorage.getItem(GITHUB_LAST_PAGE);
|
||||
|
||||
@@ -67,37 +61,20 @@ export function GitHubButton(props: GitHubButtonProps) {
|
||||
const timeSinceRedirect = now - socialRedirectAtTime;
|
||||
|
||||
if (timeSinceRedirect < 30 * 1000) {
|
||||
redirectUrl = new URL(lastPageBeforeGithub, window.location.origin);
|
||||
redirectUrl = lastPageBeforeGithub;
|
||||
}
|
||||
}
|
||||
|
||||
const authRedirectUrl = localStorage.getItem('authRedirect');
|
||||
if (authRedirectUrl) {
|
||||
localStorage.removeItem('authRedirect');
|
||||
redirectUrl = new URL(authRedirectUrl, window.location.origin);
|
||||
redirectUrl = authRedirectUrl;
|
||||
}
|
||||
|
||||
localStorage.removeItem(GITHUB_REDIRECT_AT);
|
||||
localStorage.removeItem(GITHUB_LAST_PAGE);
|
||||
setAuthToken(response.token);
|
||||
|
||||
redirectUrl.searchParams.set(
|
||||
FIRST_LOGIN_PARAM,
|
||||
response?.isNewUser ? '1' : '0',
|
||||
);
|
||||
|
||||
const shouldTriggerPurchase =
|
||||
localStorage.getItem(CHECKOUT_AFTER_LOGIN_KEY) !== '0';
|
||||
|
||||
if (
|
||||
redirectUrl.pathname.includes('/courses/sql') &&
|
||||
shouldTriggerPurchase
|
||||
) {
|
||||
redirectUrl.searchParams.set(COURSE_PURCHASE_PARAM, '1');
|
||||
localStorage.removeItem(CHECKOUT_AFTER_LOGIN_KEY);
|
||||
}
|
||||
|
||||
window.location.href = redirectUrl.toString();
|
||||
window.location.href = redirectUrl;
|
||||
})
|
||||
.catch((err) => {
|
||||
setError('Something went wrong. Please try again later.');
|
||||
@@ -143,10 +120,7 @@ export function GitHubButton(props: GitHubButtonProps) {
|
||||
return (
|
||||
<>
|
||||
<button
|
||||
className={cn(
|
||||
'inline-flex h-10 w-full items-center justify-center gap-2 rounded border border-slate-300 bg-white p-2 text-sm font-medium text-black outline-none hover:border-gray-400 hover:bg-gray-50 focus:ring-2 focus:ring-[#333] focus:ring-offset-1 disabled:cursor-not-allowed disabled:opacity-60',
|
||||
className,
|
||||
)}
|
||||
className="inline-flex h-10 w-full items-center justify-center gap-2 rounded border border-slate-300 bg-white p-2 text-sm font-medium text-black outline-none focus:ring-2 focus:ring-[#333] focus:ring-offset-1 disabled:cursor-not-allowed disabled:opacity-60"
|
||||
disabled={isLoading || isDisabled}
|
||||
onClick={handleClick}
|
||||
>
|
||||
|
||||
@@ -1,32 +1,24 @@
|
||||
import { useEffect, useState } from 'react';
|
||||
import Cookies from 'js-cookie';
|
||||
import {
|
||||
FIRST_LOGIN_PARAM,
|
||||
TOKEN_COOKIE_NAME,
|
||||
setAuthToken,
|
||||
} from '../../lib/jwt';
|
||||
import { TOKEN_COOKIE_NAME, setAuthToken } from '../../lib/jwt';
|
||||
import { httpGet } from '../../lib/http';
|
||||
import { COURSE_PURCHASE_PARAM } from '../../lib/jwt';
|
||||
import { GoogleIcon } from '../ReactIcons/GoogleIcon.tsx';
|
||||
import { Spinner } from '../ReactIcons/Spinner.tsx';
|
||||
import { CHECKOUT_AFTER_LOGIN_KEY } from './CourseLoginPopup.tsx';
|
||||
import { GoogleIcon } from '../ReactIcons/GoogleIcon.tsx';
|
||||
import {
|
||||
getStoredUtmParams,
|
||||
triggerUtmRegistration,
|
||||
} from '../../lib/browser.ts';
|
||||
import { cn } from '../../lib/classname.ts';
|
||||
|
||||
type GoogleButtonProps = {
|
||||
isDisabled?: boolean;
|
||||
setIsDisabled?: (isDisabled: boolean) => void;
|
||||
className?: string;
|
||||
};
|
||||
|
||||
const GOOGLE_REDIRECT_AT = 'googleRedirectAt';
|
||||
const GOOGLE_LAST_PAGE = 'googleLastPage';
|
||||
|
||||
export function GoogleButton(props: GoogleButtonProps) {
|
||||
const { isDisabled, setIsDisabled, className } = props;
|
||||
const { isDisabled, setIsDisabled } = props;
|
||||
|
||||
const [isLoading, setIsLoading] = useState(false);
|
||||
const [error, setError] = useState('');
|
||||
@@ -43,12 +35,14 @@ export function GoogleButton(props: GoogleButtonProps) {
|
||||
|
||||
setIsLoading(true);
|
||||
setIsDisabled?.(true);
|
||||
httpGet<{ token: string; isNewUser: boolean }>(
|
||||
httpGet<{ token: string }>(
|
||||
`${import.meta.env.PUBLIC_API_URL}/v1-google-callback${
|
||||
window.location.search
|
||||
}`,
|
||||
)
|
||||
.then(({ response, error }) => {
|
||||
const utmParams = getStoredUtmParams();
|
||||
|
||||
if (!response?.token) {
|
||||
setError(error?.message || 'Something went wrong.');
|
||||
setIsLoading(false);
|
||||
@@ -59,7 +53,7 @@ export function GoogleButton(props: GoogleButtonProps) {
|
||||
|
||||
triggerUtmRegistration();
|
||||
|
||||
let redirectUrl = new URL('/', window.location.origin);
|
||||
let redirectUrl = '/';
|
||||
const googleRedirectAt = localStorage.getItem(GOOGLE_REDIRECT_AT);
|
||||
const lastPageBeforeGoogle = localStorage.getItem(GOOGLE_LAST_PAGE);
|
||||
|
||||
@@ -71,37 +65,20 @@ export function GoogleButton(props: GoogleButtonProps) {
|
||||
const timeSinceRedirect = now - socialRedirectAtTime;
|
||||
|
||||
if (timeSinceRedirect < 30 * 1000) {
|
||||
redirectUrl = new URL(lastPageBeforeGoogle, window.location.origin);
|
||||
redirectUrl = lastPageBeforeGoogle;
|
||||
}
|
||||
}
|
||||
|
||||
const authRedirectUrl = localStorage.getItem('authRedirect');
|
||||
if (authRedirectUrl) {
|
||||
localStorage.removeItem('authRedirect');
|
||||
redirectUrl = new URL(authRedirectUrl, window.location.origin);
|
||||
}
|
||||
|
||||
redirectUrl.searchParams.set(
|
||||
FIRST_LOGIN_PARAM,
|
||||
response?.isNewUser ? '1' : '0',
|
||||
);
|
||||
|
||||
const shouldTriggerPurchase =
|
||||
localStorage.getItem(CHECKOUT_AFTER_LOGIN_KEY) !== '0';
|
||||
if (
|
||||
redirectUrl.pathname.includes('/courses/sql') &&
|
||||
shouldTriggerPurchase
|
||||
) {
|
||||
redirectUrl.searchParams.set(COURSE_PURCHASE_PARAM, '1');
|
||||
|
||||
localStorage.removeItem(CHECKOUT_AFTER_LOGIN_KEY);
|
||||
redirectUrl = authRedirectUrl;
|
||||
}
|
||||
|
||||
localStorage.removeItem(GOOGLE_REDIRECT_AT);
|
||||
localStorage.removeItem(GOOGLE_LAST_PAGE);
|
||||
setAuthToken(response.token);
|
||||
|
||||
window.location.href = redirectUrl.toString();
|
||||
window.location.href = redirectUrl;
|
||||
})
|
||||
.catch((err) => {
|
||||
setError('Something went wrong. Please try again later.');
|
||||
@@ -153,10 +130,7 @@ export function GoogleButton(props: GoogleButtonProps) {
|
||||
return (
|
||||
<>
|
||||
<button
|
||||
className={cn(
|
||||
'inline-flex h-10 w-full items-center justify-center gap-2 rounded border border-slate-300 bg-white p-2 text-sm font-medium text-black outline-none hover:border-gray-400 hover:bg-gray-50 focus:ring-2 focus:ring-[#333] focus:ring-offset-1 disabled:cursor-not-allowed disabled:opacity-60',
|
||||
className,
|
||||
)}
|
||||
className="inline-flex h-10 w-full items-center justify-center gap-2 rounded border border-slate-300 bg-white p-2 text-sm font-medium text-black outline-none focus:ring-2 focus:ring-[#333] focus:ring-offset-1 disabled:cursor-not-allowed disabled:opacity-60"
|
||||
disabled={isLoading || isDisabled}
|
||||
onClick={handleClick}
|
||||
>
|
||||
|
||||
@@ -1,29 +1,21 @@
|
||||
import { useEffect, useState } from 'react';
|
||||
import Cookies from 'js-cookie';
|
||||
import {
|
||||
FIRST_LOGIN_PARAM,
|
||||
COURSE_PURCHASE_PARAM,
|
||||
TOKEN_COOKIE_NAME,
|
||||
setAuthToken,
|
||||
} from '../../lib/jwt';
|
||||
import { cn } from '../../lib/classname.ts';
|
||||
import { TOKEN_COOKIE_NAME, setAuthToken } from '../../lib/jwt';
|
||||
import { httpGet } from '../../lib/http';
|
||||
import { LinkedInIcon } from '../ReactIcons/LinkedInIcon.tsx';
|
||||
import { Spinner } from '../ReactIcons/Spinner.tsx';
|
||||
import { CHECKOUT_AFTER_LOGIN_KEY } from './CourseLoginPopup.tsx';
|
||||
import { LinkedInIcon } from '../ReactIcons/LinkedInIcon.tsx';
|
||||
import { triggerUtmRegistration } from '../../lib/browser.ts';
|
||||
|
||||
type LinkedInButtonProps = {
|
||||
isDisabled?: boolean;
|
||||
setIsDisabled?: (isDisabled: boolean) => void;
|
||||
className?: string;
|
||||
};
|
||||
|
||||
const LINKEDIN_REDIRECT_AT = 'linkedInRedirectAt';
|
||||
const LINKEDIN_LAST_PAGE = 'linkedInLastPage';
|
||||
|
||||
export function LinkedInButton(props: LinkedInButtonProps) {
|
||||
const { isDisabled, setIsDisabled, className } = props;
|
||||
const { isDisabled, setIsDisabled } = props;
|
||||
|
||||
const [isLoading, setIsLoading] = useState(false);
|
||||
const [error, setError] = useState('');
|
||||
@@ -40,7 +32,7 @@ export function LinkedInButton(props: LinkedInButtonProps) {
|
||||
|
||||
setIsLoading(true);
|
||||
setIsDisabled?.(true);
|
||||
httpGet<{ token: string; isNewUser: boolean }>(
|
||||
httpGet<{ token: string }>(
|
||||
`${import.meta.env.PUBLIC_API_URL}/v1-linkedin-callback${
|
||||
window.location.search
|
||||
}`,
|
||||
@@ -56,7 +48,7 @@ export function LinkedInButton(props: LinkedInButtonProps) {
|
||||
|
||||
triggerUtmRegistration();
|
||||
|
||||
let redirectUrl = new URL('/', window.location.origin);
|
||||
let redirectUrl = '/';
|
||||
const linkedInRedirectAt = localStorage.getItem(LINKEDIN_REDIRECT_AT);
|
||||
const lastPageBeforeLinkedIn = localStorage.getItem(LINKEDIN_LAST_PAGE);
|
||||
|
||||
@@ -68,39 +60,20 @@ export function LinkedInButton(props: LinkedInButtonProps) {
|
||||
const timeSinceRedirect = now - socialRedirectAtTime;
|
||||
|
||||
if (timeSinceRedirect < 30 * 1000) {
|
||||
redirectUrl = new URL(
|
||||
lastPageBeforeLinkedIn,
|
||||
window.location.origin,
|
||||
);
|
||||
redirectUrl = lastPageBeforeLinkedIn;
|
||||
}
|
||||
}
|
||||
|
||||
const authRedirectUrl = localStorage.getItem('authRedirect');
|
||||
if (authRedirectUrl) {
|
||||
localStorage.removeItem('authRedirect');
|
||||
redirectUrl = new URL(authRedirectUrl, window.location.origin);
|
||||
}
|
||||
|
||||
redirectUrl.searchParams.set(
|
||||
FIRST_LOGIN_PARAM,
|
||||
response?.isNewUser ? '1' : '0',
|
||||
);
|
||||
|
||||
const shouldTriggerPurchase =
|
||||
localStorage.getItem(CHECKOUT_AFTER_LOGIN_KEY) !== '0';
|
||||
if (
|
||||
redirectUrl.pathname.includes('/courses/sql') &&
|
||||
shouldTriggerPurchase
|
||||
) {
|
||||
redirectUrl.searchParams.set(COURSE_PURCHASE_PARAM, '1');
|
||||
localStorage.removeItem(CHECKOUT_AFTER_LOGIN_KEY);
|
||||
redirectUrl = authRedirectUrl;
|
||||
}
|
||||
|
||||
localStorage.removeItem(LINKEDIN_REDIRECT_AT);
|
||||
localStorage.removeItem(LINKEDIN_LAST_PAGE);
|
||||
setAuthToken(response.token);
|
||||
|
||||
window.location.href = redirectUrl.toString();
|
||||
window.location.href = redirectUrl;
|
||||
})
|
||||
.catch((err) => {
|
||||
setError('Something went wrong. Please try again later.');
|
||||
@@ -152,17 +125,14 @@ export function LinkedInButton(props: LinkedInButtonProps) {
|
||||
return (
|
||||
<>
|
||||
<button
|
||||
className={cn(
|
||||
'inline-flex h-10 w-full items-center justify-center gap-2 rounded border border-slate-300 bg-white p-2 text-sm font-medium text-black outline-none hover:border-gray-400 focus:ring-2 focus:ring-[#333] focus:ring-offset-1 disabled:cursor-not-allowed disabled:opacity-60',
|
||||
className,
|
||||
)}
|
||||
className="inline-flex h-10 w-full items-center justify-center gap-2 rounded border border-slate-300 bg-white p-2 text-sm font-medium text-black outline-none focus:ring-2 focus:ring-[#333] focus:ring-offset-1 disabled:cursor-not-allowed disabled:opacity-60"
|
||||
disabled={isLoading || isDisabled}
|
||||
onClick={handleClick}
|
||||
>
|
||||
{isLoading ? (
|
||||
<Spinner className={'h-[18px] w-[18px]'} isDualRing={false} />
|
||||
) : (
|
||||
<LinkedInIcon className={'h-[18px] w-[18px] text-blue-700'} />
|
||||
<LinkedInIcon className={'h-[18px] w-[18px]'} />
|
||||
)}
|
||||
Continue with LinkedIn
|
||||
</button>
|
||||
|
||||
@@ -1,11 +1,7 @@
|
||||
import { useEffect, useState } from 'react';
|
||||
import Cookies from 'js-cookie';
|
||||
import { httpPost } from '../../lib/http';
|
||||
import {
|
||||
FIRST_LOGIN_PARAM,
|
||||
TOKEN_COOKIE_NAME,
|
||||
setAuthToken,
|
||||
} from '../../lib/jwt';
|
||||
import { TOKEN_COOKIE_NAME, setAuthToken } from '../../lib/jwt';
|
||||
import { Spinner } from '../ReactIcons/Spinner';
|
||||
import { ErrorIcon2 } from '../ReactIcons/ErrorIcon2';
|
||||
import { triggerUtmRegistration } from '../../lib/browser.ts';
|
||||
@@ -17,7 +13,7 @@ export function TriggerVerifyAccount() {
|
||||
const triggerVerify = (code: string) => {
|
||||
setIsLoading(true);
|
||||
|
||||
httpPost<{ token: string; isNewUser: boolean }>(
|
||||
httpPost<{ token: string }>(
|
||||
`${import.meta.env.PUBLIC_API_URL}/v1-verify-account`,
|
||||
{
|
||||
code,
|
||||
@@ -34,13 +30,7 @@ export function TriggerVerifyAccount() {
|
||||
triggerUtmRegistration();
|
||||
|
||||
setAuthToken(response.token);
|
||||
|
||||
const url = new URL('/', window.location.origin);
|
||||
url.searchParams.set(
|
||||
FIRST_LOGIN_PARAM,
|
||||
response?.isNewUser ? '1' : '0',
|
||||
);
|
||||
window.location.href = url.toString();
|
||||
window.location.href = '/';
|
||||
})
|
||||
.catch((err) => {
|
||||
setIsLoading(false);
|
||||
|
||||
@@ -1,7 +1,7 @@
|
||||
---
|
||||
import { getAllChangelogs } from '../lib/changelog';
|
||||
import { DateTime } from 'luxon';
|
||||
import AstroIcon from './AstroIcon.astro';
|
||||
|
||||
const allChangelogs = await getAllChangelogs();
|
||||
const top10Changelogs = allChangelogs.slice(0, 10);
|
||||
---
|
||||
@@ -12,18 +12,16 @@ const top10Changelogs = allChangelogs.slice(0, 10);
|
||||
<img
|
||||
src='/images/gifs/rocket.gif'
|
||||
alt='Rocket'
|
||||
class='mr-2 hidden h-12 w-12 sm:inline'
|
||||
class='mr-2 hidden sm:inline h-12 w-12'
|
||||
/>
|
||||
Actively Maintained
|
||||
</p>
|
||||
<p
|
||||
class='mb-2 mt-1 text-sm leading-relaxed text-gray-600 sm:my-2 sm:my-5 sm:text-lg'
|
||||
>
|
||||
<p class='mt-1 mb-2 sm:my-2 text-sm leading-relaxed text-gray-600 sm:my-5 sm:text-lg'>
|
||||
We are always improving our content, adding new resources and adding
|
||||
features to enhance your learning experience.
|
||||
</p>
|
||||
|
||||
<div class='relative mt-2 text-left sm:mt-8'>
|
||||
<div class='relative mt-2 sm:mt-8 text-left'>
|
||||
<div
|
||||
class='absolute inset-y-0 left-[120px] hidden w-px -translate-x-[0.5px] translate-x-[5.75px] bg-gray-300 sm:block'
|
||||
>
|
||||
@@ -38,13 +36,13 @@ const top10Changelogs = allChangelogs.slice(0, 10);
|
||||
<li class='relative'>
|
||||
<a
|
||||
href={`/changelog#${changelog.id}`}
|
||||
class='flex flex-col items-start sm:flex-row sm:items-center'
|
||||
class='flex flex-col sm:flex-row items-start sm:items-center'
|
||||
>
|
||||
<span class='flex-shrink-0 pr-0 text-right text-sm tracking-wide text-gray-400 sm:w-[120px] sm:pr-4'>
|
||||
<span class='sm:w-[120px] flex-shrink-0 pr-0 sm:pr-4 text-right text-sm tracking-wide text-gray-400'>
|
||||
{formattedDate}
|
||||
</span>
|
||||
<span class='hidden h-3 w-3 flex-shrink-0 rounded-full bg-gray-300 sm:block' />
|
||||
<span class='text-balance text-base font-medium text-gray-900 sm:pl-8'>
|
||||
<span class='h-3 w-3 flex-shrink-0 rounded-full bg-gray-300 hidden sm:block' />
|
||||
<span class='text-balance sm:pl-8 text-base font-medium text-gray-900'>
|
||||
{changelog.frontmatter.title}
|
||||
</span>
|
||||
</a>
|
||||
@@ -54,23 +52,13 @@ const top10Changelogs = allChangelogs.slice(0, 10);
|
||||
}
|
||||
</ul>
|
||||
</div>
|
||||
<div
|
||||
class='mt-2 flex flex-col gap-2 sm:flex-row sm:mt-8 sm:items-center sm:justify-center'
|
||||
>
|
||||
<div class='mt-2 sm:mt-8 text-left sm:text-center'>
|
||||
<a
|
||||
href='/changelog'
|
||||
class='inline-block rounded-lg border border-black bg-black px-4 py-2 text-sm text-white transition-colors hover:bg-gray-700 sm:rounded-full sm:px-6 sm:text-base'
|
||||
class='inline-block text-sm sm:text-base rounded-lg sm:rounded-full bg-gray-800 px-4 sm:px-6 py-2 text-white transition-colors hover:bg-gray-700'
|
||||
>
|
||||
View Full Changelog
|
||||
</a>
|
||||
<button
|
||||
data-guest-required
|
||||
data-popup='login-popup'
|
||||
class='flex flex-row items-center gap-2 rounded-lg border border-black bg-white px-4 py-2 text-sm text-black transition-all hover:bg-black hover:text-white sm:rounded-full sm:pl-4 sm:pr-5 sm:text-base'
|
||||
>
|
||||
<AstroIcon icon='bell' class='h-5 w-5' />
|
||||
Subscribe for Notifications
|
||||
</button>
|
||||
</div>
|
||||
</div>
|
||||
</div>
|
||||
|
||||
@@ -1,27 +1,20 @@
|
||||
import { useStore } from '@nanostores/react';
|
||||
import { useEffect, useState } from 'react';
|
||||
import { cn } from '../../../editor/utils/classname';
|
||||
import { useParams } from '../../hooks/use-params';
|
||||
import { useToast } from '../../hooks/use-toast';
|
||||
import { httpGet } from '../../lib/http';
|
||||
import { getUser } from '../../lib/jwt';
|
||||
import { useToast } from '../../hooks/use-toast';
|
||||
import { useStore } from '@nanostores/react';
|
||||
import { $teamList } from '../../stores/team';
|
||||
import type { TeamListResponse } from '../TeamDropdown/TeamDropdown';
|
||||
import { DashboardTabButton } from './DashboardTabButton';
|
||||
import { DashboardTab } from './DashboardTab';
|
||||
import { PersonalDashboard, type BuiltInRoadmap } from './PersonalDashboard';
|
||||
import { TeamDashboard } from './TeamDashboard';
|
||||
import type { QuestionGroupType } from '../../lib/question-group';
|
||||
import type { GuideFileType } from '../../lib/guide';
|
||||
import type { VideoFileType } from '../../lib/video';
|
||||
import { getUser } from '../../lib/jwt';
|
||||
import { useParams } from '../../hooks/use-params';
|
||||
|
||||
type DashboardPageProps = {
|
||||
builtInRoleRoadmaps?: BuiltInRoadmap[];
|
||||
builtInSkillRoadmaps?: BuiltInRoadmap[];
|
||||
builtInBestPractices?: BuiltInRoadmap[];
|
||||
isTeamPage?: boolean;
|
||||
questionGroups?: QuestionGroupType[];
|
||||
guides?: GuideFileType[];
|
||||
videos?: VideoFileType[];
|
||||
};
|
||||
|
||||
export function DashboardPage(props: DashboardPageProps) {
|
||||
@@ -30,9 +23,6 @@ export function DashboardPage(props: DashboardPageProps) {
|
||||
builtInBestPractices,
|
||||
builtInSkillRoadmaps,
|
||||
isTeamPage = false,
|
||||
questionGroups,
|
||||
guides,
|
||||
videos,
|
||||
} = props;
|
||||
|
||||
const currentUser = getUser();
|
||||
@@ -76,80 +66,78 @@ export function DashboardPage(props: DashboardPageProps) {
|
||||
: '/images/default-avatar.png';
|
||||
|
||||
return (
|
||||
<>
|
||||
<div
|
||||
className={cn('bg-slate-900', {
|
||||
'striped-loader-slate': isLoading,
|
||||
})}
|
||||
>
|
||||
<div className="bg-slate-800/30 py-5">
|
||||
<div className="container flex flex-wrap items-center gap-1.5">
|
||||
<DashboardTabButton
|
||||
label="Personal"
|
||||
isActive={!selectedTeamId && !isTeamPage}
|
||||
href="/dashboard"
|
||||
avatar={userAvatar}
|
||||
/>
|
||||
<div className="min-h-screen bg-gray-50 pb-20 pt-8">
|
||||
<div className="container">
|
||||
<div className="mb-6 flex flex-wrap items-center gap-1.5 sm:mb-8">
|
||||
<DashboardTab
|
||||
label="Personal"
|
||||
isActive={!selectedTeamId && !isTeamPage}
|
||||
href="/dashboard"
|
||||
avatar={userAvatar}
|
||||
/>
|
||||
|
||||
{!isLoading && (
|
||||
<>
|
||||
{teamList.map((team) => {
|
||||
const { avatar } = team;
|
||||
const avatarUrl = avatar
|
||||
? `${import.meta.env.PUBLIC_AVATAR_BASE_URL}/${avatar}`
|
||||
: '/images/default-avatar.png';
|
||||
return (
|
||||
<DashboardTabButton
|
||||
key={team._id}
|
||||
label={team.name}
|
||||
isActive={team._id === selectedTeamId}
|
||||
{...(team.status === 'invited'
|
||||
? {
|
||||
href: `/respond-invite?i=${team.memberId}`,
|
||||
}
|
||||
: {
|
||||
href: `/team?t=${team._id}`,
|
||||
})}
|
||||
avatar={avatarUrl}
|
||||
/>
|
||||
);
|
||||
})}
|
||||
<DashboardTabButton
|
||||
label="+ Create Team"
|
||||
isActive={false}
|
||||
href="/team/new"
|
||||
className="border border-dashed border-slate-700 bg-transparent px-3 text-[13px] text-sm text-gray-500 hover:border-solid hover:border-slate-700 hover:text-gray-400"
|
||||
/>
|
||||
</>
|
||||
)}
|
||||
</div>
|
||||
{isLoading && (
|
||||
<>
|
||||
<DashboardTabSkeleton />
|
||||
<DashboardTabSkeleton />
|
||||
</>
|
||||
)}
|
||||
|
||||
{!isLoading && (
|
||||
<>
|
||||
{teamList.map((team) => {
|
||||
const { avatar } = team;
|
||||
const avatarUrl = avatar
|
||||
? `${import.meta.env.PUBLIC_AVATAR_BASE_URL}/${avatar}`
|
||||
: '/images/default-avatar.png';
|
||||
return (
|
||||
<DashboardTab
|
||||
key={team._id}
|
||||
label={team.name}
|
||||
isActive={team._id === selectedTeamId}
|
||||
{...(team.status === 'invited'
|
||||
? {
|
||||
href: `/respond-invite?i=${team.memberId}`,
|
||||
}
|
||||
: {
|
||||
href: `/team?t=${team._id}`,
|
||||
})}
|
||||
avatar={avatarUrl}
|
||||
/>
|
||||
);
|
||||
})}
|
||||
<DashboardTab
|
||||
label="+ Create Team"
|
||||
isActive={false}
|
||||
href="/team/new"
|
||||
className="border border-dashed border-gray-300 bg-transparent px-3 text-[13px] text-sm text-gray-500 hover:border-gray-600 hover:text-black"
|
||||
/>
|
||||
</>
|
||||
)}
|
||||
</div>
|
||||
</div>
|
||||
|
||||
<div className="">
|
||||
{!selectedTeamId && !isTeamPage && (
|
||||
<div className="bg-slate-900">
|
||||
<PersonalDashboard
|
||||
builtInRoleRoadmaps={builtInRoleRoadmaps}
|
||||
builtInSkillRoadmaps={builtInSkillRoadmaps}
|
||||
builtInBestPractices={builtInBestPractices}
|
||||
questionGroups={questionGroups}
|
||||
guides={guides}
|
||||
videos={videos}
|
||||
/>
|
||||
</div>
|
||||
<PersonalDashboard
|
||||
builtInRoleRoadmaps={builtInRoleRoadmaps}
|
||||
builtInSkillRoadmaps={builtInSkillRoadmaps}
|
||||
builtInBestPractices={builtInBestPractices}
|
||||
/>
|
||||
)}
|
||||
|
||||
{(selectedTeamId || isTeamPage) && (
|
||||
<div className="container">
|
||||
<TeamDashboard
|
||||
builtInRoleRoadmaps={builtInRoleRoadmaps!}
|
||||
builtInSkillRoadmaps={builtInSkillRoadmaps!}
|
||||
teamId={selectedTeamId!}
|
||||
/>
|
||||
</div>
|
||||
<TeamDashboard
|
||||
builtInRoleRoadmaps={builtInRoleRoadmaps!}
|
||||
builtInSkillRoadmaps={builtInSkillRoadmaps!}
|
||||
teamId={selectedTeamId!}
|
||||
/>
|
||||
)}
|
||||
</div>
|
||||
</>
|
||||
</div>
|
||||
);
|
||||
}
|
||||
|
||||
function DashboardTabSkeleton() {
|
||||
return (
|
||||
<div className="h-[30px] w-[114px] animate-pulse rounded-md border bg-white"></div>
|
||||
);
|
||||
}
|
||||
|
||||
@@ -11,7 +11,7 @@ type DashboardTabProps = {
|
||||
icon?: ReactNode;
|
||||
};
|
||||
|
||||
export function DashboardTabButton(props: DashboardTabProps) {
|
||||
export function DashboardTab(props: DashboardTabProps) {
|
||||
const { isActive, onClick, label, className, href, avatar, icon } = props;
|
||||
|
||||
const Slot = href ? 'a' : 'button';
|
||||
@@ -20,10 +20,8 @@ export function DashboardTabButton(props: DashboardTabProps) {
|
||||
<Slot
|
||||
onClick={onClick}
|
||||
className={cn(
|
||||
'flex h-[30px] shrink-0 items-center gap-1 rounded-md border border-slate-700 bg-slate-800 p-1.5 pl-2 pr-3 text-sm leading-none text-gray-400 transition-colors hover:bg-slate-700',
|
||||
isActive
|
||||
? 'border-slate-200 bg-slate-200 text-gray-900 hover:bg-slate-200'
|
||||
: '',
|
||||
'flex h-[30px] shrink-0 items-center gap-1 rounded-md border bg-white p-1.5 px-2 text-sm leading-none text-gray-600',
|
||||
isActive ? 'border-gray-500 bg-gray-200 text-gray-900' : '',
|
||||
className,
|
||||
)}
|
||||
{...(href ? { href } : {})}
|
||||
@@ -32,7 +30,7 @@ export function DashboardTabButton(props: DashboardTabProps) {
|
||||
<img
|
||||
src={avatar}
|
||||
alt="avatar"
|
||||
className="mr-0.5 h-4 w-4 rounded-full object-cover"
|
||||
className="h-4 w-4 mr-0.5 rounded-full object-cover"
|
||||
/>
|
||||
)}
|
||||
{icon}
|
||||
@@ -1,35 +1,23 @@
|
||||
import { useStore } from '@nanostores/react';
|
||||
import {
|
||||
ChartColumn,
|
||||
CheckCircle,
|
||||
CheckSquare,
|
||||
FolderGit2,
|
||||
Pencil,
|
||||
SquarePen,
|
||||
Zap,
|
||||
type LucideIcon,
|
||||
} from 'lucide-react';
|
||||
import { useEffect, useState } from 'react';
|
||||
import type { AllowedProfileVisibility } from '../../api/user.ts';
|
||||
import { useToast } from '../../hooks/use-toast';
|
||||
import { cn } from '../../lib/classname.ts';
|
||||
import { type JSXElementConstructor, useEffect, useState } from 'react';
|
||||
import { httpGet } from '../../lib/http';
|
||||
import type { AllowedRoadmapRenderer } from '../../lib/roadmap.ts';
|
||||
import { $accountStreak, type StreakResponse } from '../../stores/streak';
|
||||
import type { PageType } from '../CommandMenu/CommandMenu';
|
||||
import {
|
||||
FavoriteRoadmaps,
|
||||
type AIRoadmapType,
|
||||
} from '../HeroSection/FavoriteRoadmaps.tsx';
|
||||
import { HeroRoadmap } from '../HeroSection/HeroRoadmap.tsx';
|
||||
import type { ProjectStatusDocument } from '../Projects/ListProjectSolutions';
|
||||
import type { UserProgress } from '../TeamProgress/TeamProgressPage';
|
||||
import { projectGroups } from '../../pages/index.astro';
|
||||
import type { QuestionGroupType } from '../../lib/question-group';
|
||||
import { FeaturedGuideList } from '../FeaturedGuides/FeaturedGuideList';
|
||||
import { FeaturedVideoList } from '../FeaturedVideos/FeaturedVideoList';
|
||||
import type { GuideFileType } from '../../lib/guide';
|
||||
import type { VideoFileType } from '../../lib/video';
|
||||
import type { ProjectStatusDocument } from '../Projects/ListProjectSolutions';
|
||||
import type { PageType } from '../CommandMenu/CommandMenu';
|
||||
import { useToast } from '../../hooks/use-toast';
|
||||
import { getCurrentPeriod } from '../../lib/date';
|
||||
import { ListDashboardCustomProgress } from './ListDashboardCustomProgress';
|
||||
import { RecommendedRoadmaps } from './RecommendedRoadmaps';
|
||||
import { ProgressStack } from './ProgressStack';
|
||||
import { useStore } from '@nanostores/react';
|
||||
import { $accountStreak, type StreakResponse } from '../../stores/streak';
|
||||
import { CheckEmoji } from '../ReactIcons/CheckEmoji.tsx';
|
||||
import { ConstructionEmoji } from '../ReactIcons/ConstructionEmoji.tsx';
|
||||
import { BookEmoji } from '../ReactIcons/BookEmoji.tsx';
|
||||
import { DashboardAiRoadmaps } from './DashboardAiRoadmaps.tsx';
|
||||
import type { AllowedProfileVisibility } from '../../api/user.ts';
|
||||
import { PencilIcon, type LucideIcon } from 'lucide-react';
|
||||
import { cn } from '../../lib/classname.ts';
|
||||
import type { AllowedRoadmapRenderer } from '../../lib/roadmap.ts';
|
||||
|
||||
type UserDashboardResponse = {
|
||||
name: string;
|
||||
@@ -40,7 +28,11 @@ type UserDashboardResponse = {
|
||||
profileVisibility: AllowedProfileVisibility;
|
||||
progresses: UserProgress[];
|
||||
projects: ProjectStatusDocument[];
|
||||
aiRoadmaps: AIRoadmapType[];
|
||||
aiRoadmaps: {
|
||||
id: string;
|
||||
title: string;
|
||||
slug: string;
|
||||
}[];
|
||||
topicDoneToday: number;
|
||||
};
|
||||
|
||||
@@ -50,7 +42,6 @@ export type BuiltInRoadmap = {
|
||||
title: string;
|
||||
description: string;
|
||||
isFavorite?: boolean;
|
||||
isNew?: boolean;
|
||||
relatedRoadmapIds?: string[];
|
||||
renderer?: AllowedRoadmapRenderer;
|
||||
metadata?: Record<string, any>;
|
||||
@@ -60,162 +51,16 @@ type PersonalDashboardProps = {
|
||||
builtInRoleRoadmaps?: BuiltInRoadmap[];
|
||||
builtInSkillRoadmaps?: BuiltInRoadmap[];
|
||||
builtInBestPractices?: BuiltInRoadmap[];
|
||||
questionGroups?: QuestionGroupType[];
|
||||
guides?: GuideFileType[];
|
||||
videos?: VideoFileType[];
|
||||
};
|
||||
|
||||
type DashboardStatItemProps = {
|
||||
icon: LucideIcon;
|
||||
iconClassName: string;
|
||||
value: number;
|
||||
label: string;
|
||||
isLoading: boolean;
|
||||
};
|
||||
|
||||
function DashboardStatItem(props: DashboardStatItemProps) {
|
||||
const { icon: Icon, iconClassName, value, label, isLoading } = props;
|
||||
|
||||
return (
|
||||
<div
|
||||
className={cn(
|
||||
'flex items-center gap-1.5 rounded-lg bg-slate-800/50 py-2 pl-3 pr-3',
|
||||
{
|
||||
'striped-loader-slate striped-loader-slate-fast text-transparent':
|
||||
isLoading,
|
||||
},
|
||||
)}
|
||||
>
|
||||
<Icon
|
||||
size={16}
|
||||
className={cn(iconClassName, { 'text-transparent': isLoading })}
|
||||
/>
|
||||
<span>
|
||||
<span className="tabular-nums">{value}</span> {label}
|
||||
</span>
|
||||
</div>
|
||||
);
|
||||
}
|
||||
|
||||
type ProfileButtonProps = {
|
||||
isLoading: boolean;
|
||||
name?: string;
|
||||
username?: string;
|
||||
avatar?: string;
|
||||
};
|
||||
|
||||
function PersonalProfileButton(props: ProfileButtonProps) {
|
||||
const { isLoading, name, username, avatar } = props;
|
||||
|
||||
if (isLoading || !username) {
|
||||
return (
|
||||
<a
|
||||
href="/account/update-profile"
|
||||
className={cn(
|
||||
'flex items-center gap-2 rounded-lg bg-slate-800/50 py-2 pl-3 pr-3 font-medium outline-slate-700 hover:bg-slate-800 hover:outline-slate-400',
|
||||
{
|
||||
'striped-loader-slate striped-loader-slate-fast text-transparent':
|
||||
isLoading,
|
||||
'bg-blue-500/10 text-blue-500 hover:bg-blue-500/20': !isLoading,
|
||||
},
|
||||
)}
|
||||
>
|
||||
<CheckSquare className="h-4 w-4" strokeWidth={2.5} />
|
||||
Set up your profile
|
||||
</a>
|
||||
);
|
||||
}
|
||||
|
||||
return (
|
||||
<div className="flex gap-1.5">
|
||||
<a
|
||||
href={`/u/${username}`}
|
||||
className="flex items-center gap-2 rounded-lg bg-slate-800/50 py-2 pl-3 pr-3 text-slate-300 transition-colors hover:bg-slate-800/70"
|
||||
>
|
||||
<img
|
||||
src={avatar}
|
||||
alt={name || 'Profile'}
|
||||
className="h-5 w-5 rounded-full ring-1 ring-slate-700"
|
||||
/>
|
||||
<span className="font-medium">Visit Profile</span>
|
||||
</a>
|
||||
<a
|
||||
href="/account/update-profile"
|
||||
className="flex items-center gap-2 rounded-lg bg-slate-800/50 py-2 pl-3 pr-3 text-slate-400 transition-colors hover:bg-slate-800/70 hover:text-slate-300"
|
||||
title="Edit Profile"
|
||||
>
|
||||
<SquarePen className="h-4 w-4" />
|
||||
</a>
|
||||
</div>
|
||||
);
|
||||
}
|
||||
|
||||
type DashboardStatsProps = {
|
||||
profile: ProfileButtonProps;
|
||||
accountStreak?: StreakResponse;
|
||||
topicsDoneToday?: number;
|
||||
finishedProjectsCount?: number;
|
||||
isLoading: boolean;
|
||||
};
|
||||
|
||||
function DashboardStats(props: DashboardStatsProps) {
|
||||
const {
|
||||
accountStreak,
|
||||
topicsDoneToday = 0,
|
||||
finishedProjectsCount = 0,
|
||||
isLoading,
|
||||
profile,
|
||||
} = props;
|
||||
|
||||
return (
|
||||
<div className="container mb-3 flex flex-col gap-4 pb-2 pt-6 text-sm text-slate-400 sm:flex-row sm:items-center sm:justify-between">
|
||||
<div className="flex w-full flex-col gap-4 sm:flex-row sm:items-center sm:justify-between">
|
||||
<PersonalProfileButton
|
||||
isLoading={isLoading}
|
||||
name={profile.name}
|
||||
username={profile.username}
|
||||
avatar={profile.avatar}
|
||||
/>
|
||||
<div className="hidden flex-wrap items-center gap-2 md:flex">
|
||||
<DashboardStatItem
|
||||
icon={Zap}
|
||||
iconClassName="text-yellow-500"
|
||||
value={accountStreak?.count || 0}
|
||||
label="day streak"
|
||||
isLoading={isLoading}
|
||||
/>
|
||||
<DashboardStatItem
|
||||
icon={ChartColumn}
|
||||
iconClassName="text-green-500"
|
||||
value={topicsDoneToday}
|
||||
label="learnt today"
|
||||
isLoading={isLoading}
|
||||
/>
|
||||
<DashboardStatItem
|
||||
icon={FolderGit2}
|
||||
iconClassName="text-blue-500"
|
||||
value={finishedProjectsCount}
|
||||
label="projects finished"
|
||||
isLoading={isLoading}
|
||||
/>
|
||||
</div>
|
||||
</div>
|
||||
</div>
|
||||
);
|
||||
}
|
||||
|
||||
export function PersonalDashboard(props: PersonalDashboardProps) {
|
||||
const {
|
||||
builtInRoleRoadmaps = [],
|
||||
builtInBestPractices = [],
|
||||
builtInSkillRoadmaps = [],
|
||||
questionGroups = [],
|
||||
guides = [],
|
||||
videos = [],
|
||||
} = props;
|
||||
|
||||
const toast = useToast();
|
||||
|
||||
const [isLoading, setIsLoading] = useState(true);
|
||||
const [personalDashboardDetails, setPersonalDashboardDetails] =
|
||||
useState<UserDashboardResponse>();
|
||||
@@ -293,9 +138,7 @@ export function PersonalDashboard(props: PersonalDashboardProps) {
|
||||
return () => window.removeEventListener('refresh-favorites', loadProgress);
|
||||
}, []);
|
||||
|
||||
const learningRoadmapsToShow: UserProgress[] = (
|
||||
personalDashboardDetails?.progresses || []
|
||||
)
|
||||
const learningRoadmapsToShow = (personalDashboardDetails?.progresses || [])
|
||||
.filter((progress) => !progress.isCustomResource)
|
||||
.sort((a, b) => {
|
||||
const updatedAtA = new Date(a.updatedAt);
|
||||
@@ -313,10 +156,7 @@ export function PersonalDashboard(props: PersonalDashboardProps) {
|
||||
});
|
||||
|
||||
const aiGeneratedRoadmaps = personalDashboardDetails?.aiRoadmaps || [];
|
||||
|
||||
const customRoadmaps: UserProgress[] = (
|
||||
personalDashboardDetails?.progresses || []
|
||||
)
|
||||
const customRoadmaps = (personalDashboardDetails?.progresses || [])
|
||||
.filter((progress) => progress.isCustomResource)
|
||||
.sort((a, b) => {
|
||||
const updatedAtA = new Date(a.updatedAt);
|
||||
@@ -329,6 +169,43 @@ export function PersonalDashboard(props: PersonalDashboardProps) {
|
||||
? `${import.meta.env.PUBLIC_AVATAR_BASE_URL}/${avatar}`
|
||||
: '/images/default-avatar.png';
|
||||
|
||||
const allRoadmapsAndBestPractices = [
|
||||
...builtInRoleRoadmaps,
|
||||
...builtInSkillRoadmaps,
|
||||
...builtInBestPractices,
|
||||
];
|
||||
|
||||
const relatedRoadmapIds = allRoadmapsAndBestPractices
|
||||
// take the ones that user is learning
|
||||
.filter((roadmap) =>
|
||||
learningRoadmapsToShow?.some(
|
||||
(learningRoadmap) => learningRoadmap.resourceId === roadmap.id,
|
||||
),
|
||||
)
|
||||
.flatMap((roadmap) => roadmap.relatedRoadmapIds)
|
||||
// remove the ones that user is already learning or has bookmarked
|
||||
.filter(
|
||||
(roadmapId) =>
|
||||
!learningRoadmapsToShow.some((lr) => lr.resourceId === roadmapId),
|
||||
);
|
||||
|
||||
const recommendedRoadmapIds = new Set(
|
||||
relatedRoadmapIds.length === 0
|
||||
? [
|
||||
'frontend',
|
||||
'backend',
|
||||
'devops',
|
||||
'ai-data-scientist',
|
||||
'full-stack',
|
||||
'api-design',
|
||||
]
|
||||
: relatedRoadmapIds,
|
||||
);
|
||||
|
||||
const recommendedRoadmaps = allRoadmapsAndBestPractices.filter((roadmap) =>
|
||||
recommendedRoadmapIds.has(roadmap.id),
|
||||
);
|
||||
|
||||
const enrichedProjects = personalDashboardDetails?.projects
|
||||
.map((project) => {
|
||||
const projectDetail = projectDetails.find(
|
||||
@@ -355,200 +232,165 @@ export function PersonalDashboard(props: PersonalDashboardProps) {
|
||||
const { username } = personalDashboardDetails || {};
|
||||
|
||||
return (
|
||||
<div>
|
||||
<DashboardStats
|
||||
profile={{
|
||||
name,
|
||||
username,
|
||||
avatar: avatarLink,
|
||||
isLoading,
|
||||
}}
|
||||
isLoading={isLoading}
|
||||
accountStreak={accountStreak}
|
||||
topicsDoneToday={personalDashboardDetails?.topicDoneToday}
|
||||
finishedProjectsCount={
|
||||
enrichedProjects?.filter((p) => p.submittedAt && p.repositoryUrl)
|
||||
.length
|
||||
}
|
||||
/>
|
||||
<section>
|
||||
{isLoading ? (
|
||||
<div className="h-7 w-1/4 animate-pulse rounded-lg bg-gray-200"></div>
|
||||
) : (
|
||||
<div className="flex flex-col items-start justify-between gap-1 sm:flex-row sm:items-center">
|
||||
<h2 className="text-lg font-medium">
|
||||
Hi {name}, good {getCurrentPeriod()}!
|
||||
</h2>
|
||||
<a
|
||||
href="/home"
|
||||
className="rounded-full bg-gray-200 px-2.5 py-1 text-xs font-medium text-gray-700 hover:bg-gray-300 hover:text-black"
|
||||
>
|
||||
Visit Homepage
|
||||
</a>
|
||||
</div>
|
||||
)}
|
||||
|
||||
<FavoriteRoadmaps
|
||||
progress={learningRoadmapsToShow}
|
||||
customRoadmaps={customRoadmaps}
|
||||
aiRoadmaps={aiGeneratedRoadmaps}
|
||||
<div className="mt-4 grid grid-cols-1 gap-2 sm:grid-cols-2 md:grid-cols-4">
|
||||
{isLoading ? (
|
||||
<>
|
||||
<DashboardCardSkeleton />
|
||||
<DashboardCardSkeleton />
|
||||
<DashboardCardSkeleton />
|
||||
<DashboardCardSkeleton />
|
||||
</>
|
||||
) : (
|
||||
<>
|
||||
<DashboardCard
|
||||
imgUrl={avatarLink}
|
||||
title={name!}
|
||||
description={
|
||||
username ? 'View your profile' : 'Setup your profile'
|
||||
}
|
||||
href={username ? `/u/${username}` : '/account/update-profile'}
|
||||
{...(username && {
|
||||
externalLinkIcon: PencilIcon,
|
||||
externalLinkHref: '/account/update-profile',
|
||||
externalLinkText: 'Edit',
|
||||
})}
|
||||
className={
|
||||
!username
|
||||
? 'border-dashed border-gray-500 bg-gray-100 hover:border-gray-500 hover:bg-gray-200'
|
||||
: ''
|
||||
}
|
||||
/>
|
||||
|
||||
<DashboardCard
|
||||
icon={BookEmoji}
|
||||
title="Visit Roadmaps"
|
||||
description="Learn new skills"
|
||||
href="/roadmaps"
|
||||
/>
|
||||
|
||||
<DashboardCard
|
||||
icon={ConstructionEmoji}
|
||||
title="Build Projects"
|
||||
description="Practice what you learn"
|
||||
href="/projects"
|
||||
/>
|
||||
<DashboardCard
|
||||
icon={CheckEmoji}
|
||||
title="Best Practices"
|
||||
description="Do things the right way"
|
||||
href="/best-practices"
|
||||
/>
|
||||
</>
|
||||
)}
|
||||
</div>
|
||||
|
||||
<ProgressStack
|
||||
progresses={learningRoadmapsToShow}
|
||||
projects={enrichedProjects || []}
|
||||
isLoading={isLoading}
|
||||
accountStreak={accountStreak}
|
||||
topicDoneToday={personalDashboardDetails?.topicDoneToday || 0}
|
||||
/>
|
||||
|
||||
<div className="bg-gradient-to-b from-slate-900 to-black pb-12">
|
||||
<div className="relative mt-6 border-t border-t-[#1e293c] pt-12">
|
||||
<div className="container">
|
||||
<h2
|
||||
id="role-based-roadmaps"
|
||||
className="text-md font-regular absolute -top-[17px] left-4 flex rounded-lg border border-[#1e293c] bg-slate-900 px-3 py-1 text-slate-400 sm:left-1/2 sm:-translate-x-1/2"
|
||||
>
|
||||
Role Based Roadmaps
|
||||
</h2>
|
||||
<ListDashboardCustomProgress
|
||||
progresses={customRoadmaps}
|
||||
isLoading={isLoading}
|
||||
/>
|
||||
|
||||
<div className="grid grid-cols-1 gap-3 px-2 sm:grid-cols-2 sm:px-0 lg:grid-cols-3">
|
||||
{builtInRoleRoadmaps.map((roadmap) => {
|
||||
const roadmapProgress = learningRoadmapsToShow.find(
|
||||
(lr) => lr.resourceId === roadmap.id,
|
||||
);
|
||||
<DashboardAiRoadmaps
|
||||
roadmaps={aiGeneratedRoadmaps}
|
||||
isLoading={isLoading}
|
||||
/>
|
||||
|
||||
const percentageDone =
|
||||
(((roadmapProgress?.skipped || 0) +
|
||||
(roadmapProgress?.done || 0)) /
|
||||
(roadmapProgress?.total || 1)) *
|
||||
100;
|
||||
<RecommendedRoadmaps
|
||||
roadmaps={recommendedRoadmaps}
|
||||
isLoading={isLoading}
|
||||
/>
|
||||
</section>
|
||||
);
|
||||
}
|
||||
|
||||
return (
|
||||
<HeroRoadmap
|
||||
key={roadmap.id}
|
||||
resourceId={roadmap.id}
|
||||
resourceType="roadmap"
|
||||
resourceTitle={roadmap.title}
|
||||
isFavorite={roadmap.isFavorite}
|
||||
percentageDone={percentageDone}
|
||||
isNew={roadmap.isNew}
|
||||
url={`/${roadmap.id}`}
|
||||
/>
|
||||
);
|
||||
})}
|
||||
</div>
|
||||
type DashboardCardProps = {
|
||||
icon?: JSXElementConstructor<any>;
|
||||
imgUrl?: string;
|
||||
title: string;
|
||||
description: string;
|
||||
href: string;
|
||||
externalLinkIcon?: LucideIcon;
|
||||
externalLinkText?: string;
|
||||
externalLinkHref?: string;
|
||||
className?: string;
|
||||
};
|
||||
|
||||
function DashboardCard(props: DashboardCardProps) {
|
||||
const {
|
||||
icon: Icon,
|
||||
imgUrl,
|
||||
title,
|
||||
description,
|
||||
href,
|
||||
externalLinkHref,
|
||||
externalLinkIcon: ExternalLinkIcon,
|
||||
externalLinkText,
|
||||
className,
|
||||
} = props;
|
||||
|
||||
return (
|
||||
<div className={cn('relative overflow-hidden', className)}>
|
||||
<a
|
||||
href={href}
|
||||
className="flex flex-col rounded-lg border border-gray-300 bg-white hover:border-gray-400 hover:bg-gray-50"
|
||||
>
|
||||
{Icon && (
|
||||
<div className="px-4 pb-3 pt-4">
|
||||
<Icon className="size-6" />
|
||||
</div>
|
||||
</div>
|
||||
)}
|
||||
|
||||
<div className="relative mt-12 border-t border-t-[#1e293c] pt-12">
|
||||
<div className="container">
|
||||
<h2 className="text-md font-regular absolute -top-[17px] left-4 flex rounded-lg border border-[#1e293c] bg-slate-900 px-3 py-1 text-slate-400 sm:left-1/2 sm:-translate-x-1/2">
|
||||
Skill Based Roadmaps
|
||||
</h2>
|
||||
|
||||
<div className="grid grid-cols-1 gap-3 px-2 sm:grid-cols-2 sm:px-0 lg:grid-cols-3">
|
||||
{builtInSkillRoadmaps.map((roadmap) => {
|
||||
const roadmapProgress = learningRoadmapsToShow.find(
|
||||
(lr) => lr.resourceId === roadmap.id,
|
||||
);
|
||||
|
||||
const percentageDone =
|
||||
(((roadmapProgress?.skipped || 0) +
|
||||
(roadmapProgress?.done || 0)) /
|
||||
(roadmapProgress?.total || 1)) *
|
||||
100;
|
||||
|
||||
return (
|
||||
<HeroRoadmap
|
||||
key={roadmap.id}
|
||||
resourceId={roadmap.id}
|
||||
resourceType="roadmap"
|
||||
resourceTitle={roadmap.title}
|
||||
isFavorite={roadmap.isFavorite}
|
||||
percentageDone={percentageDone}
|
||||
isNew={roadmap.isNew}
|
||||
url={`/${roadmap.id}`}
|
||||
/>
|
||||
);
|
||||
})}
|
||||
</div>
|
||||
{imgUrl && (
|
||||
<div className="px-4 pb-1.5 pt-3.5">
|
||||
<img src={imgUrl} alt={title} className="size-8 rounded-full" />
|
||||
</div>
|
||||
)}
|
||||
|
||||
<div className="flex grow flex-col justify-center gap-0.5 p-4">
|
||||
<h3 className="truncate font-medium text-black">{title}</h3>
|
||||
<p className="text-xs text-black">{description}</p>
|
||||
</div>
|
||||
</a>
|
||||
|
||||
<div className="relative mt-12 border-t border-t-[#1e293c] pt-12">
|
||||
<div className="container">
|
||||
<h2 className="text-md font-regular absolute -top-[17px] left-4 flex rounded-lg border border-[#1e293c] bg-slate-900 px-3 py-1 text-slate-400 sm:left-1/2 sm:-translate-x-1/2">
|
||||
Project Ideas
|
||||
</h2>
|
||||
|
||||
<div className="grid grid-cols-1 gap-3 px-2 sm:grid-cols-2 sm:px-0 lg:grid-cols-3">
|
||||
{projectGroups.map((projectGroup) => {
|
||||
return (
|
||||
<HeroRoadmap
|
||||
percentageDone={0}
|
||||
key={projectGroup.id}
|
||||
resourceId={projectGroup.id}
|
||||
resourceType="roadmap"
|
||||
resourceTitle={projectGroup.title}
|
||||
url={`/${projectGroup.id}/projects`}
|
||||
allowFavorite={false}
|
||||
/>
|
||||
);
|
||||
})}
|
||||
</div>
|
||||
</div>
|
||||
</div>
|
||||
|
||||
<div className="relative mt-12 border-t border-t-[#1e293c] pt-12">
|
||||
<div className="container">
|
||||
<h2 className="text-md font-regular absolute -top-[17px] left-4 flex rounded-lg border border-[#1e293c] bg-slate-900 px-3 py-1 text-slate-400 sm:left-1/2 sm:-translate-x-1/2">
|
||||
Best Practices
|
||||
</h2>
|
||||
|
||||
<div className="grid grid-cols-1 gap-3 px-2 sm:grid-cols-2 sm:px-0 lg:grid-cols-3">
|
||||
{builtInBestPractices.map((roadmap) => {
|
||||
const roadmapProgress = learningRoadmapsToShow.find(
|
||||
(lr) => lr.resourceId === roadmap.id,
|
||||
);
|
||||
|
||||
const percentageDone =
|
||||
(((roadmapProgress?.skipped || 0) +
|
||||
(roadmapProgress?.done || 0)) /
|
||||
(roadmapProgress?.total || 1)) *
|
||||
100;
|
||||
|
||||
return (
|
||||
<HeroRoadmap
|
||||
key={roadmap.id}
|
||||
resourceId={roadmap.id}
|
||||
resourceType="best-practice"
|
||||
resourceTitle={roadmap.title}
|
||||
isFavorite={roadmap.isFavorite}
|
||||
percentageDone={percentageDone}
|
||||
isNew={roadmap.isNew}
|
||||
url={`/best-practices/${roadmap.id}`}
|
||||
/>
|
||||
);
|
||||
})}
|
||||
</div>
|
||||
</div>
|
||||
</div>
|
||||
|
||||
<div className="relative mt-12 border-t border-t-[#1e293c] pt-12">
|
||||
<div className="container">
|
||||
<h2 className="text-md font-regular absolute -top-[17px] left-4 flex rounded-lg border border-[#1e293c] bg-slate-900 px-3 py-1 text-slate-400 sm:left-1/2 sm:-translate-x-1/2">
|
||||
Questions
|
||||
</h2>
|
||||
|
||||
<div className="grid grid-cols-1 gap-3 px-2 sm:grid-cols-2 sm:px-0 lg:grid-cols-3">
|
||||
{questionGroups.map((questionGroup) => {
|
||||
return (
|
||||
<HeroRoadmap
|
||||
percentageDone={0}
|
||||
key={questionGroup.id}
|
||||
resourceId={questionGroup.id}
|
||||
resourceType="roadmap"
|
||||
resourceTitle={questionGroup.frontmatter.briefTitle}
|
||||
url={`/questions/${questionGroup.id}`}
|
||||
allowFavorite={false}
|
||||
isNew={questionGroup.frontmatter.isNew}
|
||||
/>
|
||||
);
|
||||
})}
|
||||
</div>
|
||||
</div>
|
||||
</div>
|
||||
</div>
|
||||
|
||||
<div className="grid grid-cols-1 gap-5 bg-gray-50 px-4 py-5 sm:gap-16 sm:px-0 sm:py-16">
|
||||
<FeaturedGuideList
|
||||
heading="Guides"
|
||||
guides={guides}
|
||||
questions={questionGroups
|
||||
.filter((questionGroup) => questionGroup.frontmatter.authorId)
|
||||
.slice(0, 7)}
|
||||
/>
|
||||
<FeaturedVideoList heading="Videos" videos={videos} />
|
||||
</div>
|
||||
{externalLinkHref && (
|
||||
<a
|
||||
href={externalLinkHref}
|
||||
className="absolute right-1 top-1 flex items-center gap-1.5 rounded-md bg-gray-200 p-1 px-2 text-xs text-gray-600 hover:bg-gray-300 hover:text-black"
|
||||
>
|
||||
{ExternalLinkIcon && <ExternalLinkIcon className="size-3" />}
|
||||
{externalLinkText}
|
||||
</a>
|
||||
)}
|
||||
</div>
|
||||
);
|
||||
}
|
||||
|
||||
function DashboardCardSkeleton() {
|
||||
return (
|
||||
<div className="h-[128px] animate-pulse rounded-lg border border-gray-300 bg-white"></div>
|
||||
);
|
||||
}
|
||||
|
||||
@@ -6,24 +6,80 @@ import { isMobileScreen } from '../lib/is-mobile.ts';
|
||||
type FeatureAnnouncementProps = {};
|
||||
|
||||
export function FeatureAnnouncement(props: FeatureAnnouncementProps) {
|
||||
return null;
|
||||
const [isPlaying, setIsPlaying] = useState(false);
|
||||
|
||||
const videoModal = (
|
||||
<Modal
|
||||
onClose={() => setIsPlaying(false)}
|
||||
bodyClassName={'h-auto overflow-hidden'}
|
||||
wrapperClassName={'md:max-w-3xl lg:max-w-4xl xl:max-w-5xl'}
|
||||
>
|
||||
<div className="text-balance bg-gradient-to-r from-gray-100 px-4 py-2 text-left text-sm md:py-3 lg:text-base">
|
||||
<span
|
||||
className="relative -top-px mr-1.5 rounded bg-blue-300 px-1.5 py-0.5 text-xs font-semibold uppercase text-gray-800"
|
||||
style={{ lineHeight: '1.5' }}
|
||||
>
|
||||
New
|
||||
</span>
|
||||
Projects are live on the{' '}
|
||||
<a
|
||||
href={'/projects'}
|
||||
className="font-medium text-blue-500 underline underline-offset-2"
|
||||
>
|
||||
several of our roadmaps
|
||||
</a>
|
||||
<span className={'hidden md:inline'}>
|
||||
{' '}
|
||||
and are coming soon on the others
|
||||
</span>
|
||||
<PartyPopper className="relative -top-[3px] ml-2 inline-block h-5 w-5 text-blue-500 md:ml-1 md:h-6 md:w-6" />
|
||||
</div>
|
||||
<div
|
||||
className="iframe-container"
|
||||
style={{
|
||||
position: 'relative',
|
||||
paddingBottom: '56.25%',
|
||||
height: 0,
|
||||
overflow: 'hidden',
|
||||
}}
|
||||
>
|
||||
{/*https://www.youtube.com/embed/?playsinline=1&disablekb=1&&iv_load_policy=3&cc_load_policy=0&controls=0&rel=0&autoplay=1&mute=1&origin=https%3A%2F%2Fytch.xyz&widgetid=1*/}
|
||||
<iframe
|
||||
src="https://www.youtube.com/embed/9lS3slfJ0x0?start=31&autoplay=1&disablekb=1&rel=0&cc_load_policy=0&rel=0&autoplay=1&origin=https%3A%2F%2Froadmap.sh&widgetid=1&showinfo=0"
|
||||
allow="accelerometer; autoplay; clipboard-write; encrypted-media; gyroscope; picture-in-picture"
|
||||
allowFullScreen
|
||||
style={{
|
||||
position: 'absolute',
|
||||
top: 0,
|
||||
left: 0,
|
||||
width: '100%',
|
||||
height: '100%',
|
||||
}}
|
||||
/>
|
||||
</div>
|
||||
</Modal>
|
||||
);
|
||||
|
||||
return (
|
||||
<>
|
||||
<a
|
||||
{isPlaying && videoModal}
|
||||
<button
|
||||
className="rounded-md border border-dashed border-purple-600 px-3 py-1.5 text-purple-400 transition-colors hover:border-purple-400 hover:text-purple-200"
|
||||
href="/courses/sql"
|
||||
onClick={() => {
|
||||
setIsPlaying(true);
|
||||
}}
|
||||
>
|
||||
<span className="relative sm:-top-[1px] mr-1 text-xs font-semibold uppercase text-white">
|
||||
<PartyPopper className="inline-block h-4 w-4 relative -top-[2px] mr-1" />
|
||||
Courses
|
||||
<PlayCircle className="inline-block h-4 w-4 relative -top-[2px] mr-1" />
|
||||
Watch
|
||||
</span>{' '}
|
||||
<span className={'hidden sm:inline'}>
|
||||
Our first paid course about SQL is now live!
|
||||
Practice your skills with projects
|
||||
</span>
|
||||
<span className={'inline text-sm sm:hidden'}>
|
||||
Our SQL course is now live!
|
||||
Build projects to skill up
|
||||
</span>
|
||||
</a>
|
||||
</button>
|
||||
</>
|
||||
);
|
||||
}
|
||||
|
||||
47
src/components/FeaturedGuides.astro
Normal file
47
src/components/FeaturedGuides.astro
Normal file
@@ -0,0 +1,47 @@
|
||||
---
|
||||
import type { GuideFileType } from '../lib/guide';
|
||||
import GuideListItem from './GuideListItem.astro';
|
||||
import { QuestionGroupType } from '../lib/question-group';
|
||||
|
||||
export interface Props {
|
||||
heading: string;
|
||||
guides: GuideFileType[];
|
||||
questions: QuestionGroupType[];
|
||||
}
|
||||
|
||||
const { heading, guides, questions = [] } = Astro.props;
|
||||
|
||||
const sortedGuides: (QuestionGroupType | GuideFileType)[] = [
|
||||
...guides,
|
||||
...questions,
|
||||
].sort((a, b) => {
|
||||
const aDate = new Date(a.frontmatter.date);
|
||||
const bDate = new Date(b.frontmatter.date);
|
||||
|
||||
return bDate.getTime() - aDate.getTime();
|
||||
});
|
||||
---
|
||||
|
||||
<div class='container'>
|
||||
<h2 class='block text-2xl font-bold sm:text-3xl'>{heading}</h2>
|
||||
|
||||
<div class='mt-3 sm:my-5'>
|
||||
{sortedGuides.map((guide) => <GuideListItem guide={guide} />)}
|
||||
</div>
|
||||
|
||||
<a
|
||||
href='/guides'
|
||||
class='hidden rounded-full bg-gradient-to-r from-slate-600 to-black px-3 py-2 text-xs font-medium text-white transition-colors hover:from-blue-600 hover:to-blue-800 sm:inline'
|
||||
>
|
||||
View All Guides →
|
||||
</a>
|
||||
|
||||
<div class='mt-3 block sm:hidden'>
|
||||
<a
|
||||
href='/guides'
|
||||
class='font-regular block rounded-md border border-black p-2 text-center text-sm text-black hover:bg-black hover:text-gray-50'
|
||||
>
|
||||
View All Guides →
|
||||
</a>
|
||||
</div>
|
||||
</div>
|
||||
@@ -1,51 +0,0 @@
|
||||
import type { GuideFileType } from '../../lib/guide';
|
||||
import type { QuestionGroupType } from '../../lib/question-group';
|
||||
import { GuideListItem } from './GuideListItem';
|
||||
|
||||
export interface FeaturedGuidesProps {
|
||||
heading: string;
|
||||
guides: GuideFileType[];
|
||||
questions: QuestionGroupType[];
|
||||
}
|
||||
|
||||
export function FeaturedGuideList(props: FeaturedGuidesProps) {
|
||||
const { heading, guides, questions = [] } = props;
|
||||
|
||||
const sortedGuides: (QuestionGroupType | GuideFileType)[] = [
|
||||
...guides,
|
||||
...questions,
|
||||
].sort((a, b) => {
|
||||
const aDate = new Date(a.frontmatter.date as string);
|
||||
const bDate = new Date(b.frontmatter.date as string);
|
||||
|
||||
return bDate.getTime() - aDate.getTime();
|
||||
});
|
||||
|
||||
return (
|
||||
<div className="container">
|
||||
<h2 className="block text-2xl font-bold sm:text-3xl">{heading}</h2>
|
||||
|
||||
<div className="mt-3 sm:my-5">
|
||||
{sortedGuides.map((guide) => (
|
||||
<GuideListItem key={guide.id} guide={guide} />
|
||||
))}
|
||||
</div>
|
||||
|
||||
<a
|
||||
href="/guides"
|
||||
className="hidden rounded-full bg-gradient-to-r from-slate-600 to-black px-3 py-2 text-xs font-medium text-white transition-colors hover:from-blue-600 hover:to-blue-800 sm:inline"
|
||||
>
|
||||
View All Guides →
|
||||
</a>
|
||||
|
||||
<div className="mt-3 block sm:hidden">
|
||||
<a
|
||||
href="/guides"
|
||||
className="font-regular block rounded-md border border-black p-2 text-center text-sm text-black hover:bg-black hover:text-gray-50"
|
||||
>
|
||||
View All Guides →
|
||||
</a>
|
||||
</div>
|
||||
</div>
|
||||
);
|
||||
}
|
||||
@@ -1,57 +0,0 @@
|
||||
import type { GuideFileType, GuideFrontmatter } from '../../lib/guide';
|
||||
import { type QuestionGroupType } from '../../lib/question-group';
|
||||
|
||||
export interface GuideListItemProps {
|
||||
guide: GuideFileType | QuestionGroupType;
|
||||
}
|
||||
|
||||
function isQuestionGroupType(
|
||||
guide: GuideFileType | QuestionGroupType,
|
||||
): guide is QuestionGroupType {
|
||||
return (guide as QuestionGroupType).questions !== undefined;
|
||||
}
|
||||
|
||||
export function GuideListItem(props: GuideListItemProps) {
|
||||
const { guide } = props;
|
||||
const { frontmatter, id } = guide;
|
||||
|
||||
let pageUrl = '';
|
||||
let guideType = '';
|
||||
|
||||
if (isQuestionGroupType(guide)) {
|
||||
pageUrl = `/questions/${id}`;
|
||||
guideType = 'Questions';
|
||||
} else {
|
||||
const excludedBySlug = (frontmatter as GuideFrontmatter).excludedBySlug;
|
||||
pageUrl = excludedBySlug ? excludedBySlug : `/guides/${id}`;
|
||||
guideType = (frontmatter as GuideFrontmatter).type;
|
||||
}
|
||||
|
||||
return (
|
||||
<a
|
||||
className="text-md group block flex items-center justify-between border-b py-2 text-gray-600 no-underline hover:text-blue-600"
|
||||
href={pageUrl}
|
||||
>
|
||||
<span className="text-sm transition-transform group-hover:translate-x-2 md:text-base">
|
||||
{frontmatter.title}
|
||||
|
||||
{frontmatter.isNew && (
|
||||
<span className="ml-2.5 rounded-sm bg-green-300 px-1.5 py-0.5 text-xs font-medium uppercase text-green-900">
|
||||
New
|
||||
<span className="hidden sm:inline">
|
||||
·
|
||||
{new Date(frontmatter.date || '').toLocaleString('default', {
|
||||
month: 'long',
|
||||
})}
|
||||
</span>
|
||||
</span>
|
||||
)}
|
||||
</span>
|
||||
<span className="hidden text-xs capitalize text-gray-500 sm:block">
|
||||
{guideType}
|
||||
</span>
|
||||
|
||||
<span className="block text-xs text-gray-400 sm:hidden"> »</span>
|
||||
</a>
|
||||
);
|
||||
}
|
||||
35
src/components/FeaturedVideos.astro
Normal file
35
src/components/FeaturedVideos.astro
Normal file
@@ -0,0 +1,35 @@
|
||||
---
|
||||
import type { VideoFileType } from '../lib/video';
|
||||
import VideoListItem from './VideoListItem.astro';
|
||||
|
||||
export interface Props {
|
||||
heading: string;
|
||||
videos: VideoFileType[];
|
||||
}
|
||||
|
||||
const { heading, videos } = Astro.props;
|
||||
---
|
||||
|
||||
<div class='container'>
|
||||
<h2 class='text-2xl sm:text-3xl font-bold block'>{heading}</h2>
|
||||
|
||||
<div class='mt-3 sm:my-5'>
|
||||
{videos.map((video) => <VideoListItem video={video} />)}
|
||||
</div>
|
||||
|
||||
<a
|
||||
href='/videos'
|
||||
class='hidden sm:inline transition-colors py-2 px-3 text-xs font-medium rounded-full bg-gradient-to-r from-slate-600 to-black hover:from-blue-600 hover:to-blue-800 text-white'
|
||||
>
|
||||
View All Videos →
|
||||
</a>
|
||||
|
||||
<div class='block sm:hidden mt-3'>
|
||||
<a
|
||||
href='/videos'
|
||||
class='text-sm font-regular block p-2 border border-black text-black rounded-md text-center hover:bg-black hover:text-gray-50'
|
||||
>
|
||||
View All Videos →
|
||||
</a>
|
||||
</div>
|
||||
</div>
|
||||
@@ -1,39 +0,0 @@
|
||||
import type { VideoFileType } from '../../lib/video';
|
||||
import { VideoListItem } from './VideoListItem';
|
||||
|
||||
export interface FeaturedVideoListProps {
|
||||
heading: string;
|
||||
videos: VideoFileType[];
|
||||
}
|
||||
|
||||
export function FeaturedVideoList(props: FeaturedVideoListProps) {
|
||||
const { heading, videos } = props;
|
||||
|
||||
return (
|
||||
<div className="container">
|
||||
<h2 className="block text-2xl font-bold sm:text-3xl">{heading}</h2>
|
||||
|
||||
<div className="mt-3 sm:my-5">
|
||||
{videos.map((video) => (
|
||||
<VideoListItem key={video.id} video={video} />
|
||||
))}
|
||||
</div>
|
||||
|
||||
<a
|
||||
href="/videos"
|
||||
className="hidden rounded-full bg-gradient-to-r from-slate-600 to-black px-3 py-2 text-xs font-medium text-white transition-colors hover:from-blue-600 hover:to-blue-800 sm:inline"
|
||||
>
|
||||
View All Videos →
|
||||
</a>
|
||||
|
||||
<div className="mt-3 block sm:hidden">
|
||||
<a
|
||||
href="/videos"
|
||||
className="font-regular block rounded-md border border-black p-2 text-center text-sm text-black hover:bg-black hover:text-gray-50"
|
||||
>
|
||||
View All Videos →
|
||||
</a>
|
||||
</div>
|
||||
</div>
|
||||
);
|
||||
}
|
||||
@@ -1,38 +0,0 @@
|
||||
import type { VideoFileType } from '../../lib/video';
|
||||
|
||||
export interface VideoListItemProps {
|
||||
video: VideoFileType;
|
||||
}
|
||||
|
||||
export function VideoListItem(props: VideoListItemProps) {
|
||||
const { video } = props;
|
||||
const { frontmatter, id } = video;
|
||||
|
||||
return (
|
||||
<a
|
||||
className="block no-underline py-2 group text-md items-center text-gray-600 hover:text-blue-600 flex justify-between border-b"
|
||||
href={`/videos/${id}`}
|
||||
>
|
||||
<span className="group-hover:translate-x-2 transition-transform">
|
||||
{frontmatter.title}
|
||||
|
||||
{frontmatter.isNew && (
|
||||
<span className="bg-green-300 text-green-900 text-xs font-medium px-1.5 py-0.5 rounded-sm uppercase ml-1.5">
|
||||
New
|
||||
<span className="hidden sm:inline">
|
||||
·
|
||||
{new Date(frontmatter.date).toLocaleString('default', {
|
||||
month: 'long',
|
||||
})}
|
||||
</span>
|
||||
</span>
|
||||
)}
|
||||
</span>
|
||||
<span className="capitalize text-gray-500 text-xs hidden sm:block">
|
||||
{frontmatter.duration}
|
||||
</span>
|
||||
|
||||
<span className="text-gray-400 text-xs block sm:hidden"> »</span>
|
||||
</a>
|
||||
);
|
||||
}
|
||||
61
src/components/GuideListItem.astro
Normal file
61
src/components/GuideListItem.astro
Normal file
@@ -0,0 +1,61 @@
|
||||
---
|
||||
import type { GuideFileType, GuideFrontmatter } from '../lib/guide';
|
||||
import { type QuestionGroupType } from '../lib/question-group';
|
||||
|
||||
export interface Props {
|
||||
guide: GuideFileType | QuestionGroupType;
|
||||
}
|
||||
|
||||
function isQuestionGroupType(
|
||||
guide: GuideFileType | QuestionGroupType,
|
||||
): guide is QuestionGroupType {
|
||||
return (guide as QuestionGroupType).questions !== undefined;
|
||||
}
|
||||
|
||||
const { guide } = Astro.props;
|
||||
const { frontmatter, id } = guide;
|
||||
|
||||
let pageUrl = '';
|
||||
let guideType = '';
|
||||
|
||||
if (isQuestionGroupType(guide)) {
|
||||
pageUrl = `/questions/${id}`;
|
||||
guideType = 'Questions';
|
||||
} else {
|
||||
const excludedBySlug = (frontmatter as GuideFrontmatter).excludedBySlug;
|
||||
pageUrl = excludedBySlug ? excludedBySlug : `/guides/${id}`;
|
||||
guideType = (frontmatter as GuideFrontmatter).type;
|
||||
}
|
||||
---
|
||||
|
||||
<a
|
||||
class:list={[
|
||||
'text-md group block flex items-center justify-between border-b py-2 text-gray-600 no-underline hover:text-blue-600',
|
||||
]}
|
||||
href={pageUrl}
|
||||
>
|
||||
<span
|
||||
class='text-sm transition-transform group-hover:translate-x-2 md:text-base'
|
||||
>
|
||||
{frontmatter.title}
|
||||
|
||||
{
|
||||
frontmatter.isNew && (
|
||||
<span class='ml-1.5 rounded-sm bg-green-300 px-1.5 py-0.5 text-xs font-medium uppercase text-green-900'>
|
||||
New
|
||||
<span class='hidden sm:inline'>
|
||||
·
|
||||
{new Date(frontmatter.date || '').toLocaleString('default', {
|
||||
month: 'long',
|
||||
})}
|
||||
</span>
|
||||
</span>
|
||||
)
|
||||
}
|
||||
</span>
|
||||
<span class='hidden text-xs capitalize text-gray-500 sm:block'>
|
||||
{guideType}
|
||||
</span>
|
||||
|
||||
<span class='block text-xs text-gray-400 sm:hidden'> »</span>
|
||||
</a>
|
||||
@@ -1,229 +1,164 @@
|
||||
import {
|
||||
FolderKanban,
|
||||
MapIcon,
|
||||
Plus,
|
||||
Sparkle,
|
||||
Eye,
|
||||
EyeOff,
|
||||
Square,
|
||||
SquareCheckBig,
|
||||
} from 'lucide-react';
|
||||
import { useState } from 'react';
|
||||
import type { ProjectStatusDocument } from '../Projects/ListProjectSolutions.tsx';
|
||||
import { CheckIcon } from '../ReactIcons/CheckIcon.tsx';
|
||||
import type { UserProgress } from '../TeamProgress/TeamProgressPage.tsx';
|
||||
import { HeroProject } from './HeroProject';
|
||||
import { HeroRoadmap } from './HeroRoadmap';
|
||||
import { CreateRoadmapButton } from '../CustomRoadmap/CreateRoadmap/CreateRoadmapButton.tsx';
|
||||
import { HeroItemsGroup } from './HeroItemsGroup';
|
||||
import { CreateRoadmapModal } from '../CustomRoadmap/CreateRoadmap/CreateRoadmapModal.tsx';
|
||||
import { useEffect, useState } from 'react';
|
||||
import { EmptyProgress } from './EmptyProgress';
|
||||
import { httpGet } from '../../lib/http';
|
||||
import { HeroRoadmaps, type HeroTeamRoadmaps } from './HeroRoadmaps';
|
||||
import { isLoggedIn } from '../../lib/jwt';
|
||||
import type { AllowedMemberRoles } from '../ShareOptions/ShareTeamMemberList.tsx';
|
||||
|
||||
export type AIRoadmapType = {
|
||||
id: string;
|
||||
title: string;
|
||||
slug: string;
|
||||
};
|
||||
export type UserProgressResponse = {
|
||||
resourceId: string;
|
||||
resourceType: 'roadmap' | 'best-practice';
|
||||
resourceTitle: string;
|
||||
isFavorite: boolean;
|
||||
done: number;
|
||||
learning: number;
|
||||
skipped: number;
|
||||
total: number;
|
||||
updatedAt: Date;
|
||||
isCustomResource: boolean;
|
||||
roadmapSlug?: string;
|
||||
team?: {
|
||||
name: string;
|
||||
id: string;
|
||||
role: AllowedMemberRoles;
|
||||
};
|
||||
}[];
|
||||
|
||||
type FavoriteRoadmapsProps = {
|
||||
progress: UserProgress[];
|
||||
projects: (ProjectStatusDocument & {
|
||||
title: string;
|
||||
})[];
|
||||
customRoadmaps: UserProgress[];
|
||||
aiRoadmaps: AIRoadmapType[];
|
||||
isLoading: boolean;
|
||||
};
|
||||
function renderProgress(progressList: UserProgressResponse) {
|
||||
progressList.forEach((progress) => {
|
||||
const href =
|
||||
progress.resourceType === 'best-practice'
|
||||
? `/best-practices/${progress.resourceId}`
|
||||
: `/${progress.resourceId}`;
|
||||
const element = document.querySelector(`a[href="${href}"]`);
|
||||
if (!element) {
|
||||
return;
|
||||
}
|
||||
|
||||
export function FavoriteRoadmaps(props: FavoriteRoadmapsProps) {
|
||||
const { progress, isLoading, customRoadmaps, aiRoadmaps, projects } = props;
|
||||
const [showCompleted, setShowCompleted] = useState(false);
|
||||
const [isCreatingCustomRoadmap, setIsCreatingCustomRoadmap] = useState(false);
|
||||
window.dispatchEvent(
|
||||
new CustomEvent('mark-favorite', {
|
||||
detail: {
|
||||
resourceId: progress.resourceId,
|
||||
resourceType: progress.resourceType,
|
||||
isFavorite: progress.isFavorite,
|
||||
},
|
||||
}),
|
||||
);
|
||||
|
||||
const completedProjects = projects.filter(
|
||||
(project) => project.submittedAt && project.repositoryUrl,
|
||||
);
|
||||
const inProgressProjects = projects.filter(
|
||||
(project) => !project.submittedAt || !project.repositoryUrl,
|
||||
const totalDone = progress.done + progress.skipped;
|
||||
const percentageDone = (totalDone / progress.total) * 100;
|
||||
|
||||
const progressBar: HTMLElement | null =
|
||||
element.querySelector('[data-progress]');
|
||||
if (progressBar) {
|
||||
progressBar.style.width = `${percentageDone}%`;
|
||||
}
|
||||
});
|
||||
}
|
||||
|
||||
type ProgressResponse = UserProgressResponse;
|
||||
|
||||
export function FavoriteRoadmaps() {
|
||||
const isAuthenticated = isLoggedIn();
|
||||
if (!isAuthenticated) {
|
||||
return null;
|
||||
}
|
||||
|
||||
const [isPreparing, setIsPreparing] = useState(true);
|
||||
const [isLoading, setIsLoading] = useState(true);
|
||||
const [progress, setProgress] = useState<ProgressResponse>([]);
|
||||
const [containerOpacity, setContainerOpacity] = useState(0);
|
||||
|
||||
function showProgressContainer() {
|
||||
const heroEl = document.getElementById('hero-text')!;
|
||||
if (!heroEl) {
|
||||
return;
|
||||
}
|
||||
|
||||
heroEl.classList.add('opacity-0');
|
||||
setTimeout(() => {
|
||||
heroEl.parentElement?.removeChild(heroEl);
|
||||
setIsPreparing(false);
|
||||
|
||||
setTimeout(() => {
|
||||
setContainerOpacity(100);
|
||||
}, 50);
|
||||
}, 0);
|
||||
}
|
||||
|
||||
async function loadProgress() {
|
||||
setIsLoading(true);
|
||||
|
||||
const { response: progressList, error } = await httpGet<ProgressResponse>(
|
||||
`${import.meta.env.PUBLIC_API_URL}/v1-get-hero-roadmaps`,
|
||||
);
|
||||
|
||||
if (error || !progressList) {
|
||||
return;
|
||||
}
|
||||
|
||||
setProgress(progressList);
|
||||
setIsLoading(false);
|
||||
showProgressContainer();
|
||||
|
||||
// render progress on featured items
|
||||
renderProgress(progressList);
|
||||
}
|
||||
|
||||
useEffect(() => {
|
||||
loadProgress().finally(() => {
|
||||
setIsLoading(false);
|
||||
});
|
||||
}, []);
|
||||
|
||||
useEffect(() => {
|
||||
window.addEventListener('refresh-favorites', loadProgress);
|
||||
return () => window.removeEventListener('refresh-favorites', loadProgress);
|
||||
}, []);
|
||||
|
||||
if (isPreparing) {
|
||||
return null;
|
||||
}
|
||||
|
||||
const hasProgress = progress?.length > 0;
|
||||
const customRoadmaps = progress?.filter(
|
||||
(p) => p.isCustomResource && !p.team?.name,
|
||||
);
|
||||
const defaultRoadmaps = progress?.filter((p) => !p.isCustomResource);
|
||||
const teamRoadmaps: HeroTeamRoadmaps = progress
|
||||
?.filter((p) => p.isCustomResource && p.team?.name)
|
||||
.reduce((acc: HeroTeamRoadmaps, curr) => {
|
||||
const currTeam = curr.team!;
|
||||
if (!acc[currTeam.name]) {
|
||||
acc[currTeam.name] = [];
|
||||
}
|
||||
|
||||
const projectsToShow = [
|
||||
...inProgressProjects,
|
||||
...(showCompleted ? completedProjects : []),
|
||||
];
|
||||
acc[currTeam.name].push(curr);
|
||||
|
||||
return acc;
|
||||
}, {});
|
||||
|
||||
return (
|
||||
<div className="flex flex-col">
|
||||
{isCreatingCustomRoadmap && (
|
||||
<CreateRoadmapModal
|
||||
onClose={() => {
|
||||
setIsCreatingCustomRoadmap(false);
|
||||
}}
|
||||
/>
|
||||
)}
|
||||
|
||||
<HeroItemsGroup
|
||||
icon={<CheckIcon additionalClasses="mr-1.5 h-[14px] w-[14px]" />}
|
||||
isLoading={isLoading}
|
||||
title="Your progress and bookmarks"
|
||||
isEmpty={!isLoading && progress.length === 0}
|
||||
emptyTitle={
|
||||
<>
|
||||
No bookmars found
|
||||
<a
|
||||
href="#role-based-roadmaps"
|
||||
className="ml-1.5 inline-flex items-center gap-1 font-medium text-blue-500 underline-offset-2 hover:underline"
|
||||
>
|
||||
<SquareCheckBig className="size-3.5" strokeWidth={2.5} />
|
||||
Bookmark a roadmap
|
||||
</a>
|
||||
</>
|
||||
}
|
||||
<div
|
||||
className={`transition-opacity duration-500 opacity-${containerOpacity}`}
|
||||
>
|
||||
<div
|
||||
className={`flex min-h-[192px] bg-gradient-to-b sm:min-h-[280px] ${
|
||||
hasProgress && `border-t border-t-[#1e293c]`
|
||||
}`}
|
||||
>
|
||||
{progress.map((resource) => (
|
||||
<HeroRoadmap
|
||||
key={`${resource.resourceType}-${resource.resourceId}`}
|
||||
resourceId={resource.resourceId}
|
||||
resourceType={resource.resourceType}
|
||||
resourceTitle={resource.resourceTitle}
|
||||
isFavorite={resource.isFavorite}
|
||||
percentageDone={
|
||||
((resource.skipped + resource.done) / resource.total) * 100
|
||||
}
|
||||
url={
|
||||
resource.resourceType === 'roadmap'
|
||||
? `/${resource.resourceId}`
|
||||
: `/best-practices/${resource.resourceId}`
|
||||
}
|
||||
/>
|
||||
))}
|
||||
</HeroItemsGroup>
|
||||
|
||||
<HeroItemsGroup
|
||||
icon={<MapIcon className="mr-1.5 h-[14px] w-[14px]" />}
|
||||
isLoading={isLoading}
|
||||
title="Your custom roadmaps"
|
||||
isEmpty={!isLoading && customRoadmaps.length === 0}
|
||||
emptyTitle={
|
||||
<>
|
||||
No custom roadmaps found
|
||||
<button
|
||||
onClick={() => {
|
||||
setIsCreatingCustomRoadmap(true);
|
||||
}}
|
||||
className="ml-1.5 inline-flex items-center gap-1 font-medium text-blue-500 underline-offset-2 hover:underline"
|
||||
>
|
||||
<SquareCheckBig className="size-3.5" strokeWidth={2.5} />
|
||||
Create custom roadmap
|
||||
</button>
|
||||
</>
|
||||
}
|
||||
>
|
||||
{customRoadmaps.map((customRoadmap) => (
|
||||
<HeroRoadmap
|
||||
key={customRoadmap.resourceId}
|
||||
resourceId={customRoadmap.resourceId}
|
||||
resourceType={'roadmap'}
|
||||
resourceTitle={customRoadmap.resourceTitle}
|
||||
percentageDone={
|
||||
((customRoadmap.skipped + customRoadmap.done) /
|
||||
customRoadmap.total) *
|
||||
100
|
||||
}
|
||||
url={`/r/${customRoadmap?.roadmapSlug}`}
|
||||
allowFavorite={false}
|
||||
/>
|
||||
))}
|
||||
<CreateRoadmapButton />
|
||||
</HeroItemsGroup>
|
||||
|
||||
<HeroItemsGroup
|
||||
icon={<Sparkle className="mr-1.5 h-[14px] w-[14px]" />}
|
||||
isLoading={isLoading}
|
||||
title="Your AI roadmaps"
|
||||
isEmpty={!isLoading && aiRoadmaps.length === 0}
|
||||
emptyTitle={
|
||||
<>
|
||||
No AI roadmaps found
|
||||
<a
|
||||
href="/ai"
|
||||
className="ml-1.5 inline-flex items-center gap-1 font-medium text-blue-500 underline-offset-2 hover:underline"
|
||||
>
|
||||
<SquareCheckBig className="size-3.5" strokeWidth={2.5} />
|
||||
Generate AI roadmap
|
||||
</a>
|
||||
</>
|
||||
}
|
||||
>
|
||||
{aiRoadmaps.map((aiRoadmap) => (
|
||||
<HeroRoadmap
|
||||
key={aiRoadmap.id}
|
||||
resourceId={aiRoadmap.id}
|
||||
resourceType={'roadmap'}
|
||||
resourceTitle={aiRoadmap.title}
|
||||
url={`/ai/${aiRoadmap.slug}`}
|
||||
percentageDone={0}
|
||||
allowFavorite={false}
|
||||
isTrackable={false}
|
||||
/>
|
||||
))}
|
||||
|
||||
<a
|
||||
href="/ai"
|
||||
className={
|
||||
'flex h-full w-full items-center justify-center gap-1 overflow-hidden rounded-md border border-dashed border-gray-800 p-3 text-sm text-gray-400 hover:border-gray-600 hover:bg-gray-900 hover:text-gray-300'
|
||||
}
|
||||
>
|
||||
<Plus size={16} />
|
||||
Generate New
|
||||
</a>
|
||||
</HeroItemsGroup>
|
||||
|
||||
<HeroItemsGroup
|
||||
icon={<FolderKanban className="mr-1.5 h-[14px] w-[14px]" />}
|
||||
isLoading={isLoading}
|
||||
title="Your active projects"
|
||||
isEmpty={!isLoading && projectsToShow.length === 0}
|
||||
emptyTitle={
|
||||
<>
|
||||
No active projects found
|
||||
<a
|
||||
href="/projects"
|
||||
className="ml-1.5 inline-flex items-center gap-1 font-medium text-blue-500 underline-offset-2 hover:underline"
|
||||
>
|
||||
<SquareCheckBig className="size-3.5" strokeWidth={2.5} />
|
||||
Start a new project
|
||||
</a>
|
||||
</>
|
||||
}
|
||||
rightContent={
|
||||
completedProjects.length > 0 && (
|
||||
<button
|
||||
onClick={() => setShowCompleted(!showCompleted)}
|
||||
className="hidden items-center gap-2 rounded-md text-xs text-slate-400 hover:text-slate-300 sm:flex"
|
||||
>
|
||||
{showCompleted ? (
|
||||
<EyeOff className="h-3.5 w-3.5" />
|
||||
) : (
|
||||
<Eye className="h-3.5 w-3.5" />
|
||||
)}
|
||||
{completedProjects.length} Completed
|
||||
</button>
|
||||
)
|
||||
}
|
||||
className="border-b-0"
|
||||
>
|
||||
{projectsToShow.map((project) => (
|
||||
<HeroProject key={project._id} project={project} />
|
||||
))}
|
||||
|
||||
<a
|
||||
href="/projects"
|
||||
className="flex min-h-[80px] items-center justify-center gap-2 rounded-md border border-dashed border-slate-800 p-4 text-sm text-slate-400 hover:border-slate-600 hover:bg-slate-900/50 hover:text-slate-300"
|
||||
>
|
||||
<Plus size={16} />
|
||||
Start a new project
|
||||
</a>
|
||||
</HeroItemsGroup>
|
||||
<div className="container min-h-full">
|
||||
{!isLoading && progress?.length == 0 && <EmptyProgress />}
|
||||
{hasProgress && (
|
||||
<HeroRoadmaps
|
||||
teamRoadmaps={teamRoadmaps}
|
||||
customRoadmaps={customRoadmaps}
|
||||
progress={defaultRoadmaps}
|
||||
isLoading={isLoading}
|
||||
/>
|
||||
)}
|
||||
</div>
|
||||
</div>
|
||||
</div>
|
||||
);
|
||||
}
|
||||
|
||||
@@ -1,78 +0,0 @@
|
||||
import { useEffect, useRef, useState, type ReactNode } from 'react';
|
||||
import { cn } from '../../lib/classname';
|
||||
import { HeroTitle } from './HeroTitle';
|
||||
|
||||
type HeroItemsGroupProps = {
|
||||
icon: any;
|
||||
isLoading?: boolean;
|
||||
isEmpty?: boolean;
|
||||
emptyTitle?: ReactNode;
|
||||
title: string | ReactNode;
|
||||
rightContent?: ReactNode;
|
||||
children?: ReactNode;
|
||||
className?: string;
|
||||
};
|
||||
|
||||
export function HeroItemsGroup(props: HeroItemsGroupProps) {
|
||||
const {
|
||||
icon,
|
||||
isLoading = false,
|
||||
isEmpty = false,
|
||||
emptyTitle,
|
||||
title,
|
||||
rightContent,
|
||||
children,
|
||||
className,
|
||||
} = props;
|
||||
|
||||
const storageKey = `hero-group-${title}-collapsed`;
|
||||
const [isCollapsed, setIsCollapsed] = useState(true);
|
||||
|
||||
function isCollapsedByStorage() {
|
||||
const stored = localStorage.getItem(storageKey);
|
||||
|
||||
return stored === 'true';
|
||||
}
|
||||
|
||||
useEffect(() => {
|
||||
setIsCollapsed(isCollapsedByStorage());
|
||||
}, [isLoading]);
|
||||
|
||||
const isLoadingOrCollapsedOrEmpty = isLoading || isCollapsed || isEmpty;
|
||||
|
||||
return (
|
||||
<div
|
||||
className={cn(
|
||||
'border-b border-gray-800/50',
|
||||
{
|
||||
'py-4': !isLoadingOrCollapsedOrEmpty,
|
||||
'py-4 ': isLoadingOrCollapsedOrEmpty,
|
||||
'opacity-50 transition-opacity hover:opacity-100':
|
||||
isCollapsed && !isLoading,
|
||||
},
|
||||
className,
|
||||
)}
|
||||
>
|
||||
<div className="container">
|
||||
<HeroTitle
|
||||
icon={icon}
|
||||
isLoading={isLoading}
|
||||
isEmpty={isEmpty}
|
||||
emptyTitle={emptyTitle}
|
||||
title={title}
|
||||
rightContent={rightContent}
|
||||
isCollapsed={isCollapsed}
|
||||
onToggleCollapse={() => {
|
||||
setIsCollapsed(!isCollapsed);
|
||||
localStorage.setItem(storageKey, (!isCollapsed).toString());
|
||||
}}
|
||||
/>
|
||||
{!isLoadingOrCollapsedOrEmpty && (
|
||||
<div className="mt-4 grid grid-cols-1 gap-2.5 sm:grid-cols-2 md:grid-cols-3">
|
||||
{children}
|
||||
</div>
|
||||
)}
|
||||
</div>
|
||||
</div>
|
||||
);
|
||||
}
|
||||
@@ -1,52 +0,0 @@
|
||||
import { ThumbsUp } from 'lucide-react';
|
||||
import { cn } from '../../lib/classname.ts';
|
||||
import { getRelativeTimeString } from '../../lib/date';
|
||||
import type { ProjectStatusDocument } from '../Projects/ListProjectSolutions.tsx';
|
||||
|
||||
type HeroProjectProps = {
|
||||
project: ProjectStatusDocument & {
|
||||
title: string;
|
||||
};
|
||||
};
|
||||
|
||||
export function HeroProject({ project }: HeroProjectProps) {
|
||||
return (
|
||||
<a
|
||||
href={`/projects/${project.projectId}`}
|
||||
className="group relative flex flex-col justify-between gap-2 rounded-md border border-slate-800 bg-slate-900 p-3.5 hover:border-slate-600"
|
||||
>
|
||||
<div className="relative z-10 flex items-start justify-between gap-2">
|
||||
<h3 className="truncate font-medium text-slate-300 group-hover:text-slate-100">
|
||||
{project.title}
|
||||
</h3>
|
||||
<span
|
||||
className={cn(
|
||||
'absolute -right-2 -top-2 flex flex-shrink-0 items-center gap-1 rounded-full text-xs uppercase tracking-wide',
|
||||
{
|
||||
'text-green-600/50': project.submittedAt && project.repositoryUrl,
|
||||
'text-yellow-600': !project.submittedAt || !project.repositoryUrl,
|
||||
},
|
||||
)}
|
||||
>
|
||||
{project.submittedAt && project.repositoryUrl ? 'Done' : ''}
|
||||
</span>
|
||||
</div>
|
||||
<div className="relative z-10 flex items-center gap-2 text-xs text-slate-400">
|
||||
{project.submittedAt && project.repositoryUrl && (
|
||||
<span className="flex items-center gap-1">
|
||||
<ThumbsUp className="h-3 w-3" />
|
||||
{project.upvotes}
|
||||
</span>
|
||||
)}
|
||||
{project.startedAt && (
|
||||
<span>Started {getRelativeTimeString(project.startedAt)}</span>
|
||||
)}
|
||||
</div>
|
||||
|
||||
<div className="absolute inset-0 rounded-md bg-gradient-to-br from-slate-800/50 via-transparent to-transparent" />
|
||||
{project.submittedAt && project.repositoryUrl && (
|
||||
<div className="absolute inset-0 rounded-md bg-gradient-to-br from-green-950/20 via-transparent to-transparent" />
|
||||
)}
|
||||
</a>
|
||||
);
|
||||
}
|
||||
@@ -1,74 +0,0 @@
|
||||
import { cn } from '../../lib/classname.ts';
|
||||
import type { ResourceType } from '../../lib/resource-progress.ts';
|
||||
import { MarkFavorite } from '../FeaturedItems/MarkFavorite.tsx';
|
||||
|
||||
type ProgressRoadmapProps = {
|
||||
url: string;
|
||||
percentageDone: number;
|
||||
allowFavorite?: boolean;
|
||||
|
||||
resourceId: string;
|
||||
resourceType: ResourceType;
|
||||
resourceTitle: string;
|
||||
isFavorite?: boolean;
|
||||
|
||||
isTrackable?: boolean;
|
||||
isNew?: boolean;
|
||||
};
|
||||
|
||||
export function HeroRoadmap(props: ProgressRoadmapProps) {
|
||||
const {
|
||||
url,
|
||||
percentageDone,
|
||||
resourceType,
|
||||
resourceId,
|
||||
resourceTitle,
|
||||
isFavorite,
|
||||
allowFavorite = true,
|
||||
isTrackable = true,
|
||||
isNew = false,
|
||||
} = props;
|
||||
|
||||
return (
|
||||
<a
|
||||
href={url}
|
||||
className={cn(
|
||||
'relative flex flex-col overflow-hidden rounded-md border p-3 text-sm text-slate-400 hover:text-slate-300',
|
||||
{
|
||||
'border-slate-800 bg-slate-900 hover:border-slate-600': isTrackable,
|
||||
'border-slate-700/50 bg-slate-800/50 hover:border-slate-600/70':
|
||||
!isTrackable,
|
||||
},
|
||||
)}
|
||||
>
|
||||
<span title={resourceTitle} className="relative z-20 truncate">
|
||||
{resourceTitle}
|
||||
</span>
|
||||
|
||||
{isTrackable && (
|
||||
<span
|
||||
className="absolute bottom-0 left-0 top-0 z-10 bg-[#172a3a]"
|
||||
style={{ width: `${percentageDone}%` }}
|
||||
></span>
|
||||
)}
|
||||
|
||||
{allowFavorite && (
|
||||
<MarkFavorite
|
||||
resourceId={resourceId}
|
||||
resourceType={resourceType}
|
||||
favorite={isFavorite}
|
||||
/>
|
||||
)}
|
||||
|
||||
{isNew && (
|
||||
<span className="absolute bottom-1.5 right-2 flex items-center rounded-br rounded-tl text-xs font-medium text-purple-300">
|
||||
<span className="mr-1.5 flex h-2 w-2">
|
||||
<span className="absolute inline-flex h-2 w-2 animate-ping rounded-full bg-purple-400 opacity-75" />
|
||||
<span className="relative inline-flex h-2 w-2 rounded-full bg-purple-500" />
|
||||
</span>
|
||||
New
|
||||
</span>
|
||||
)}
|
||||
</a>
|
||||
);
|
||||
}
|
||||
264
src/components/HeroSection/HeroRoadmaps.tsx
Normal file
264
src/components/HeroSection/HeroRoadmaps.tsx
Normal file
@@ -0,0 +1,264 @@
|
||||
import type { UserProgressResponse } from './FavoriteRoadmaps';
|
||||
import { CheckIcon } from '../ReactIcons/CheckIcon';
|
||||
import { MarkFavorite } from '../FeaturedItems/MarkFavorite';
|
||||
import { Spinner } from '../ReactIcons/Spinner';
|
||||
import type { ResourceType } from '../../lib/resource-progress';
|
||||
import { MapIcon, Users2 } from 'lucide-react';
|
||||
import { CreateRoadmapButton } from '../CustomRoadmap/CreateRoadmap/CreateRoadmapButton';
|
||||
import { CreateRoadmapModal } from '../CustomRoadmap/CreateRoadmap/CreateRoadmapModal';
|
||||
import { type ReactNode, useState } from 'react';
|
||||
import { FeatureAnnouncement } from '../FeatureAnnouncement.tsx';
|
||||
|
||||
type ProgressRoadmapProps = {
|
||||
url: string;
|
||||
percentageDone: number;
|
||||
allowFavorite?: boolean;
|
||||
|
||||
resourceId: string;
|
||||
resourceType: ResourceType;
|
||||
resourceTitle: string;
|
||||
isFavorite?: boolean;
|
||||
};
|
||||
function HeroRoadmap(props: ProgressRoadmapProps) {
|
||||
const {
|
||||
url,
|
||||
percentageDone,
|
||||
resourceType,
|
||||
resourceId,
|
||||
resourceTitle,
|
||||
isFavorite,
|
||||
allowFavorite = true,
|
||||
} = props;
|
||||
|
||||
return (
|
||||
<a
|
||||
href={url}
|
||||
className="relative flex flex-col overflow-hidden rounded-md border border-slate-800 bg-slate-900 p-3 text-sm text-slate-400 hover:border-slate-600 hover:text-slate-300"
|
||||
>
|
||||
<span className="relative z-20">{resourceTitle}</span>
|
||||
|
||||
<span
|
||||
className="absolute bottom-0 left-0 top-0 z-10 bg-[#172a3a]"
|
||||
style={{ width: `${percentageDone}%` }}
|
||||
></span>
|
||||
|
||||
{allowFavorite && (
|
||||
<MarkFavorite
|
||||
resourceId={resourceId}
|
||||
resourceType={resourceType}
|
||||
favorite={isFavorite}
|
||||
/>
|
||||
)}
|
||||
</a>
|
||||
);
|
||||
}
|
||||
|
||||
type ProgressTitleProps = {
|
||||
icon: any;
|
||||
isLoading?: boolean;
|
||||
title: string | ReactNode;
|
||||
};
|
||||
|
||||
export function HeroTitle(props: ProgressTitleProps) {
|
||||
const { isLoading = false, title, icon } = props;
|
||||
|
||||
return (
|
||||
<p className="mb-4 flex items-center text-sm text-gray-400">
|
||||
{!isLoading && icon}
|
||||
{isLoading && (
|
||||
<span className="mr-1.5">
|
||||
<Spinner />
|
||||
</span>
|
||||
)}
|
||||
{title}
|
||||
</p>
|
||||
);
|
||||
}
|
||||
export type HeroTeamRoadmaps = Record<string, UserProgressResponse>;
|
||||
|
||||
type ProgressListProps = {
|
||||
progress: UserProgressResponse;
|
||||
customRoadmaps: UserProgressResponse;
|
||||
teamRoadmaps?: HeroTeamRoadmaps;
|
||||
isLoading?: boolean;
|
||||
};
|
||||
|
||||
export function HeroRoadmaps(props: ProgressListProps) {
|
||||
const {
|
||||
teamRoadmaps = {},
|
||||
progress,
|
||||
isLoading = false,
|
||||
customRoadmaps,
|
||||
} = props;
|
||||
|
||||
const [isCreatingRoadmap, setIsCreatingRoadmap] = useState(false);
|
||||
const [creatingRoadmapTeamId, setCreatingRoadmapTeamId] = useState<string>();
|
||||
|
||||
return (
|
||||
<div className="relative pb-12 pt-4 sm:pt-7">
|
||||
<p className="mb-7 mt-2 text-sm">
|
||||
<FeatureAnnouncement />
|
||||
</p>
|
||||
{isCreatingRoadmap && (
|
||||
<CreateRoadmapModal
|
||||
teamId={creatingRoadmapTeamId}
|
||||
onClose={() => {
|
||||
setIsCreatingRoadmap(false);
|
||||
setCreatingRoadmapTeamId(undefined);
|
||||
}}
|
||||
/>
|
||||
)}
|
||||
{
|
||||
<HeroTitle
|
||||
icon={
|
||||
(<CheckIcon additionalClasses="mr-1.5 h-[14px] w-[14px]" />) as any
|
||||
}
|
||||
isLoading={isLoading}
|
||||
title="Your progress and favorite roadmaps."
|
||||
/>
|
||||
}
|
||||
|
||||
<div className="grid grid-cols-1 gap-2 sm:grid-cols-2 md:grid-cols-3">
|
||||
{progress.map((resource) => (
|
||||
<HeroRoadmap
|
||||
key={`${resource.resourceType}-${resource.resourceId}`}
|
||||
resourceId={resource.resourceId}
|
||||
resourceType={resource.resourceType}
|
||||
resourceTitle={resource.resourceTitle}
|
||||
isFavorite={resource.isFavorite}
|
||||
percentageDone={
|
||||
((resource.skipped + resource.done) / resource.total) * 100
|
||||
}
|
||||
url={
|
||||
resource.resourceType === 'roadmap'
|
||||
? `/${resource.resourceId}`
|
||||
: `/best-practices/${resource.resourceId}`
|
||||
}
|
||||
/>
|
||||
))}
|
||||
</div>
|
||||
|
||||
<div className="mt-5">
|
||||
{
|
||||
<HeroTitle
|
||||
icon={<MapIcon className="mr-1.5 h-[14px] w-[14px]" />}
|
||||
title="Your custom roadmaps"
|
||||
/>
|
||||
}
|
||||
|
||||
{customRoadmaps.length === 0 && (
|
||||
<p className="rounded-md border border-dashed border-gray-800 p-2 text-sm text-gray-600">
|
||||
You haven't created any custom roadmaps yet.{' '}
|
||||
<button
|
||||
className="text-gray-500 underline underline-offset-2 hover:text-gray-400"
|
||||
onClick={() => setIsCreatingRoadmap(true)}
|
||||
>
|
||||
Create one!
|
||||
</button>
|
||||
</p>
|
||||
)}
|
||||
|
||||
{customRoadmaps.length > 0 && (
|
||||
<div className="grid grid-cols-1 gap-2 sm:grid-cols-2 md:grid-cols-3">
|
||||
{customRoadmaps.map((customRoadmap) => {
|
||||
return (
|
||||
<HeroRoadmap
|
||||
key={customRoadmap.resourceId}
|
||||
resourceId={customRoadmap.resourceId}
|
||||
resourceType={'roadmap'}
|
||||
resourceTitle={customRoadmap.resourceTitle}
|
||||
percentageDone={
|
||||
((customRoadmap.skipped + customRoadmap.done) /
|
||||
customRoadmap.total) *
|
||||
100
|
||||
}
|
||||
url={`/r/${customRoadmap?.roadmapSlug}`}
|
||||
allowFavorite={false}
|
||||
/>
|
||||
);
|
||||
})}
|
||||
|
||||
<CreateRoadmapButton />
|
||||
</div>
|
||||
)}
|
||||
</div>
|
||||
|
||||
{Object.keys(teamRoadmaps).map((teamName) => {
|
||||
const currentTeam: UserProgressResponse[0]['team'] =
|
||||
teamRoadmaps?.[teamName]?.[0]?.team;
|
||||
const roadmapsList = teamRoadmaps[teamName].filter(
|
||||
(roadmap) => !!roadmap.resourceTitle,
|
||||
);
|
||||
const canManageTeam = ['admin', 'manager'].includes(currentTeam?.role!);
|
||||
|
||||
return (
|
||||
<div className="mt-5" key={teamName}>
|
||||
{
|
||||
<HeroTitle
|
||||
icon={<Users2 className="mr-1.5 h-[14px] w-[14px]" />}
|
||||
title={
|
||||
<>
|
||||
Team{' '}
|
||||
<a
|
||||
className="mx-1 font-medium underline underline-offset-2 transition-colors hover:text-gray-300"
|
||||
href={`/team/activity?t=${currentTeam?.id}`}
|
||||
>
|
||||
{teamName}
|
||||
</a>
|
||||
Roadmaps
|
||||
</>
|
||||
}
|
||||
/>
|
||||
}
|
||||
|
||||
{roadmapsList.length === 0 && (
|
||||
<p className="rounded-md border border-dashed border-gray-800 p-2 text-sm text-gray-600">
|
||||
Team does not have any roadmaps yet.{' '}
|
||||
{canManageTeam && (
|
||||
<button
|
||||
className="text-gray-500 underline underline-offset-2 hover:text-gray-400"
|
||||
onClick={() => {
|
||||
setCreatingRoadmapTeamId(currentTeam?.id);
|
||||
setIsCreatingRoadmap(true);
|
||||
}}
|
||||
>
|
||||
Create one!
|
||||
</button>
|
||||
)}
|
||||
</p>
|
||||
)}
|
||||
|
||||
{roadmapsList.length > 0 && (
|
||||
<div className="grid grid-cols-1 gap-2 sm:grid-cols-2 md:grid-cols-3">
|
||||
{roadmapsList.map((customRoadmap) => {
|
||||
return (
|
||||
<HeroRoadmap
|
||||
key={customRoadmap.resourceId}
|
||||
resourceId={customRoadmap.resourceId}
|
||||
resourceType={'roadmap'}
|
||||
resourceTitle={customRoadmap.resourceTitle}
|
||||
percentageDone={
|
||||
((customRoadmap.skipped + customRoadmap.done) /
|
||||
customRoadmap.total) *
|
||||
100
|
||||
}
|
||||
url={`/r/${customRoadmap?.roadmapSlug}`}
|
||||
allowFavorite={false}
|
||||
/>
|
||||
);
|
||||
})}
|
||||
|
||||
{canManageTeam && (
|
||||
<CreateRoadmapButton
|
||||
teamId={currentTeam?.id}
|
||||
text="Create Team Roadmap"
|
||||
/>
|
||||
)}
|
||||
</div>
|
||||
)}
|
||||
</div>
|
||||
);
|
||||
})}
|
||||
</div>
|
||||
);
|
||||
}
|
||||
@@ -1,71 +0,0 @@
|
||||
import type { ReactNode } from 'react';
|
||||
import { Spinner } from '../ReactIcons/Spinner.tsx';
|
||||
import { ChevronDown, ChevronsDownUp, ChevronsUpDown } from 'lucide-react';
|
||||
import { cn } from '../../lib/classname.ts';
|
||||
|
||||
type HeroTitleProps = {
|
||||
icon: any;
|
||||
isLoading?: boolean;
|
||||
title: string | ReactNode;
|
||||
rightContent?: ReactNode;
|
||||
isCollapsed?: boolean;
|
||||
onToggleCollapse?: () => void;
|
||||
isEmpty?: boolean;
|
||||
emptyTitle?: ReactNode;
|
||||
};
|
||||
|
||||
export function HeroTitle(props: HeroTitleProps) {
|
||||
const {
|
||||
isLoading = false,
|
||||
title,
|
||||
icon,
|
||||
rightContent,
|
||||
isCollapsed = false,
|
||||
onToggleCollapse,
|
||||
isEmpty = false,
|
||||
emptyTitle,
|
||||
} = props;
|
||||
|
||||
return (
|
||||
<div className="flex items-center justify-between">
|
||||
<div className="flex items-center gap-3">
|
||||
<p className="flex items-center gap-0.5 text-sm text-gray-400">
|
||||
{!isLoading && icon}
|
||||
{isLoading && (
|
||||
<span className="mr-1.5">
|
||||
<Spinner />
|
||||
</span>
|
||||
)}
|
||||
{!isEmpty ? title : emptyTitle || title}
|
||||
</p>
|
||||
</div>
|
||||
<div className="flex items-center gap-2">
|
||||
{!isCollapsed && rightContent}
|
||||
|
||||
{!isLoading && !isEmpty && (
|
||||
<button
|
||||
onClick={onToggleCollapse}
|
||||
className={cn(
|
||||
'ml-2 inline-flex items-center gap-1 rounded-md bg-slate-800 py-0.5 pl-1 pr-1.5 text-xs uppercase tracking-wider text-slate-400 hover:bg-slate-700',
|
||||
{
|
||||
'bg-slate-800 text-slate-500 hover:bg-slate-800 hover:text-slate-400':
|
||||
!isCollapsed,
|
||||
},
|
||||
)}
|
||||
>
|
||||
{isCollapsed && (
|
||||
<>
|
||||
<ChevronsUpDown className="h-3.5 w-3.5" /> Expand
|
||||
</>
|
||||
)}
|
||||
{!isCollapsed && (
|
||||
<>
|
||||
<ChevronsDownUp className="h-3.5 w-3.5" /> Collapse
|
||||
</>
|
||||
)}
|
||||
</button>
|
||||
)}
|
||||
</div>
|
||||
</div>
|
||||
);
|
||||
}
|
||||
@@ -8,7 +8,7 @@ const { class: className } = Astro.props;
|
||||
|
||||
<div
|
||||
class:list={[
|
||||
'container prose prose-xl prose-h2:mb-3 prose-h2:mt-10 prose-h2:scroll-mt-5 prose-h2:text-balance prose-h2:text-3xl prose-h3:mt-2 prose-h4:text-2xl prose-h3:scroll-mt-5 prose-h3:text-balance prose-h4:text-balance prose-h5:text-balance prose-h5:font-medium prose-blockquote:font-normal prose-code:bg-transparent prose-img:mt-1 prose-h2:sm:scroll-mt-10 prose-h3:sm:scroll-mt-10',
|
||||
'container prose prose-xl prose-h2:mb-3 prose-h2:mt-10 prose-h2:scroll-mt-5 prose-h2:text-balance prose-h2:text-3xl prose-h3:mt-2 prose-h3:scroll-mt-5 prose-h3:text-balance prose-h4:text-balance prose-h5:text-balance prose-h5:font-medium prose-blockquote:font-normal prose-code:bg-transparent prose-img:mt-1 prose-h2:sm:scroll-mt-10 prose-h3:sm:scroll-mt-10',
|
||||
className,
|
||||
]}
|
||||
>
|
||||
|
||||
@@ -1,14 +1,13 @@
|
||||
---
|
||||
import { AccountStreak } from '../AccountStreak/AccountStreak';
|
||||
import { Menu } from 'lucide-react';
|
||||
import Icon from '../AstroIcon.astro';
|
||||
import { NavigationDropdown } from '../NavigationDropdown';
|
||||
import { RoadmapDropdownMenu } from '../RoadmapDropdownMenu/RoadmapDropdownMenu';
|
||||
import { AccountDropdown } from './AccountDropdown';
|
||||
import { CourseAnnouncement } from '../SQLCourse/CourseAnnouncement';
|
||||
import NewIndicator from './NewIndicator.astro';
|
||||
import { AccountStreak } from '../AccountStreak/AccountStreak';
|
||||
import { RoadmapDropdownMenu } from '../RoadmapDropdownMenu/RoadmapDropdownMenu';
|
||||
---
|
||||
|
||||
<CourseAnnouncement client:load />
|
||||
|
||||
<div class='bg-slate-900 py-5 text-white sm:py-8'>
|
||||
<nav class='container flex items-center justify-between'>
|
||||
<div class='flex items-center gap-5'>
|
||||
@@ -49,7 +48,7 @@ import { CourseAnnouncement } from '../SQLCourse/CourseAnnouncement';
|
||||
</a>
|
||||
<a
|
||||
href='/changelog'
|
||||
class='group relative ml-0.5 hidden text-blue-300 hover:text-white md:block'
|
||||
class='group relative text-blue-300 hover:text-white hidden md:block ml-0.5'
|
||||
>
|
||||
Changelog
|
||||
|
||||
|
||||
@@ -109,7 +109,7 @@ export function NavigationDropdown() {
|
||||
</button>
|
||||
<div
|
||||
className={cn(
|
||||
'pointer-events-none invisible absolute left-0 top-full z-[90] mt-2 w-48 min-w-[320px] -translate-y-1 rounded-lg bg-slate-800 py-2 opacity-0 shadow-xl transition-all duration-100',
|
||||
'pointer-events-none invisible absolute left-0 top-full z-[999] mt-2 w-48 min-w-[320px] -translate-y-1 rounded-lg bg-slate-800 py-2 opacity-0 shadow-xl transition-all duration-100',
|
||||
{
|
||||
'pointer-events-auto visible translate-y-2.5 opacity-100':
|
||||
$navigationDropdownOpen,
|
||||
|
||||
@@ -37,9 +37,6 @@ export function OnboardingNudge(props: OnboardingNudgeProps) {
|
||||
return null;
|
||||
}
|
||||
|
||||
// @TODO put it back once <CourseAnnouncement /> is removed
|
||||
return null;
|
||||
|
||||
return (
|
||||
<div
|
||||
className={cn(
|
||||
|
||||
@@ -16,8 +16,6 @@ import { GitHubIcon } from '../ReactIcons/GitHubIcon.tsx';
|
||||
import { SelectLanguages } from './SelectLanguages.tsx';
|
||||
import type { ProjectFrontmatter } from '../../lib/project.ts';
|
||||
import { ProjectSolutionModal } from './ProjectSolutionModal.tsx';
|
||||
import { SortProjects } from './SortProjects.tsx';
|
||||
import { ProjectSolutionRow } from './ProjectSolutionRow';
|
||||
|
||||
export interface ProjectStatusDocument {
|
||||
_id?: string;
|
||||
@@ -59,13 +57,11 @@ type ListProjectSolutionsResponse = {
|
||||
type QueryParams = {
|
||||
p?: string;
|
||||
l?: string;
|
||||
s?: string;
|
||||
};
|
||||
|
||||
type PageState = {
|
||||
currentPage: number;
|
||||
language: string;
|
||||
sort: string;
|
||||
};
|
||||
|
||||
type ListProjectSolutionsProps = {
|
||||
@@ -73,6 +69,30 @@ type ListProjectSolutionsProps = {
|
||||
projectId: string;
|
||||
};
|
||||
|
||||
export const submittedAlternatives = [
|
||||
'submitted their solution',
|
||||
'got it done',
|
||||
'submitted their take',
|
||||
'finished the project',
|
||||
'submitted their work',
|
||||
'completed the project',
|
||||
'got it done',
|
||||
'delivered their project',
|
||||
'handed in their solution',
|
||||
'provided their deliverables',
|
||||
'submitted their approach',
|
||||
'sent in their project',
|
||||
'presented their take',
|
||||
'shared their completed task',
|
||||
'submitted their approach',
|
||||
'completed it',
|
||||
'finalized their solution',
|
||||
'delivered their approach',
|
||||
'turned in their project',
|
||||
'submitted their final draft',
|
||||
'delivered their solution',
|
||||
];
|
||||
|
||||
export function ListProjectSolutions(props: ListProjectSolutionsProps) {
|
||||
const { projectId, project: projectData } = props;
|
||||
|
||||
@@ -80,7 +100,6 @@ export function ListProjectSolutions(props: ListProjectSolutionsProps) {
|
||||
const [pageState, setPageState] = useState<PageState>({
|
||||
currentPage: 0,
|
||||
language: '',
|
||||
sort: 'rating',
|
||||
});
|
||||
|
||||
const [isLoading, setIsLoading] = useState(true);
|
||||
@@ -89,17 +108,12 @@ export function ListProjectSolutions(props: ListProjectSolutionsProps) {
|
||||
ListProjectSolutionsResponse['data'][number] | null
|
||||
>(null);
|
||||
|
||||
const loadSolutions = async (
|
||||
page = 1,
|
||||
language: string = '',
|
||||
sort: string = 'rating',
|
||||
) => {
|
||||
const loadSolutions = async (page = 1, language: string = '') => {
|
||||
const { response, error } = await httpGet<ListProjectSolutionsResponse>(
|
||||
`${import.meta.env.PUBLIC_API_URL}/v1-list-project-solutions/${projectId}`,
|
||||
{
|
||||
currPage: page,
|
||||
...(language ? { languages: language } : {}),
|
||||
sort,
|
||||
},
|
||||
);
|
||||
|
||||
@@ -164,7 +178,6 @@ export function ListProjectSolutions(props: ListProjectSolutionsProps) {
|
||||
setPageState({
|
||||
currentPage: +(queryParams.p || '1'),
|
||||
language: queryParams.l || '',
|
||||
sort: queryParams.s || 'rating',
|
||||
});
|
||||
}, []);
|
||||
|
||||
@@ -174,27 +187,17 @@ export function ListProjectSolutions(props: ListProjectSolutionsProps) {
|
||||
return;
|
||||
}
|
||||
|
||||
if (
|
||||
pageState.currentPage !== 1 ||
|
||||
pageState.language !== '' ||
|
||||
pageState.sort !== 'rating'
|
||||
) {
|
||||
if (pageState.currentPage !== 1 || pageState.language !== '') {
|
||||
setUrlParams({
|
||||
p: String(pageState.currentPage),
|
||||
l: pageState.language,
|
||||
s: pageState.sort,
|
||||
});
|
||||
} else {
|
||||
deleteUrlParam('p');
|
||||
deleteUrlParam('l');
|
||||
deleteUrlParam('s');
|
||||
}
|
||||
|
||||
loadSolutions(
|
||||
pageState.currentPage,
|
||||
pageState.language,
|
||||
pageState.sort,
|
||||
).finally(() => {
|
||||
loadSolutions(pageState.currentPage, pageState.language).finally(() => {
|
||||
setIsLoading(false);
|
||||
});
|
||||
}, [pageState]);
|
||||
@@ -213,13 +216,6 @@ export function ListProjectSolutions(props: ListProjectSolutionsProps) {
|
||||
|
||||
const selectedLanguage = pageState.language;
|
||||
|
||||
const setSelectedLanguage = (language: string) => {
|
||||
setPageState((prev) => ({
|
||||
...prev,
|
||||
language: prev.language === language ? '' : language,
|
||||
}));
|
||||
};
|
||||
|
||||
return (
|
||||
<div className="mb-4 overflow-hidden rounded-lg border bg-white p-3 sm:p-5">
|
||||
{leavingRoadmapModal}
|
||||
@@ -228,32 +224,19 @@ export function ListProjectSolutions(props: ListProjectSolutionsProps) {
|
||||
<h1 className="mb-1 text-xl font-semibold">
|
||||
{projectData.title} Solutions
|
||||
</h1>
|
||||
<p className="text-sm text-gray-500">
|
||||
Solutions submitted by the community
|
||||
</p>
|
||||
<p className="text-sm text-gray-500">{projectData.description}</p>
|
||||
</div>
|
||||
{!isLoading && (
|
||||
<div className="flex flex-shrink-0 items-center gap-2">
|
||||
<SortProjects
|
||||
selectedSort={pageState.sort}
|
||||
onSelectSort={(sort) => {
|
||||
setPageState((prev) => ({
|
||||
...prev,
|
||||
sort,
|
||||
}));
|
||||
}}
|
||||
/>
|
||||
<SelectLanguages
|
||||
projectId={projectId}
|
||||
selectedLanguage={selectedLanguage}
|
||||
onSelectLanguage={(language) => {
|
||||
setPageState((prev) => ({
|
||||
...prev,
|
||||
language: prev.language === language ? '' : language,
|
||||
}));
|
||||
}}
|
||||
/>
|
||||
</div>
|
||||
<SelectLanguages
|
||||
projectId={projectId}
|
||||
selectedLanguage={selectedLanguage}
|
||||
onSelectLanguage={(language) => {
|
||||
setPageState((prev) => ({
|
||||
...prev,
|
||||
language: prev.language === language ? '' : language,
|
||||
}));
|
||||
}}
|
||||
/>
|
||||
)}
|
||||
</div>
|
||||
|
||||
@@ -262,16 +245,73 @@ export function ListProjectSolutions(props: ListProjectSolutionsProps) {
|
||||
) : (
|
||||
<>
|
||||
<div className="flex min-h-[500px] flex-col divide-y divide-gray-100">
|
||||
{solutions?.data.map((solution, counter) => (
|
||||
<ProjectSolutionRow
|
||||
key={solution._id}
|
||||
solution={solution}
|
||||
counter={counter}
|
||||
onVote={handleSubmitVote}
|
||||
onVisitSolution={setShowLeavingRoadmapModal}
|
||||
onLanguageClick={setSelectedLanguage}
|
||||
/>
|
||||
))}
|
||||
{solutions?.data.map((solution, counter) => {
|
||||
const avatar = solution.user.avatar || '';
|
||||
return (
|
||||
<div
|
||||
key={solution._id}
|
||||
className="flex flex-col gap-2 py-2 text-sm text-gray-500"
|
||||
>
|
||||
<div className="flex flex-col justify-between gap-2 text-sm text-gray-500 sm:flex-row sm:items-center sm:gap-0">
|
||||
<div className="flex items-center gap-1.5">
|
||||
<img
|
||||
src={
|
||||
avatar
|
||||
? `${import.meta.env.PUBLIC_AVATAR_BASE_URL}/${avatar}`
|
||||
: '/images/default-avatar.png'
|
||||
}
|
||||
alt={solution.user.name}
|
||||
className="mr-0.5 h-7 w-7 rounded-full"
|
||||
/>
|
||||
<span className="font-medium text-black">
|
||||
{solution.user.name}
|
||||
</span>
|
||||
<span className="hidden sm:inline">
|
||||
{submittedAlternatives[
|
||||
counter % submittedAlternatives.length
|
||||
] || 'submitted their solution'}
|
||||
</span>{' '}
|
||||
<span className="flex-grow text-right text-gray-400 sm:flex-grow-0 sm:text-left sm:font-medium sm:text-black">
|
||||
{getRelativeTimeString(solution?.submittedAt!)}
|
||||
</span>
|
||||
</div>
|
||||
|
||||
<div className="flex items-center justify-end gap-1">
|
||||
<span className="flex shrink-0 overflow-hidden rounded-full border">
|
||||
<VoteButton
|
||||
icon={ThumbsUp}
|
||||
isActive={solution?.voteType === 'upvote'}
|
||||
count={solution.upvotes || 0}
|
||||
onClick={() => {
|
||||
handleSubmitVote(solution._id!, 'upvote');
|
||||
}}
|
||||
/>
|
||||
|
||||
<VoteButton
|
||||
icon={ThumbsDown}
|
||||
isActive={solution?.voteType === 'downvote'}
|
||||
count={solution.downvotes || 0}
|
||||
hideCount={true}
|
||||
onClick={() => {
|
||||
handleSubmitVote(solution._id!, 'downvote');
|
||||
}}
|
||||
/>
|
||||
</span>
|
||||
|
||||
<button
|
||||
className="ml-1 flex items-center gap-1 rounded-full border px-2 py-1 text-xs text-black transition-colors hover:border-black hover:bg-black hover:text-white"
|
||||
onClick={() => {
|
||||
setShowLeavingRoadmapModal(solution);
|
||||
}}
|
||||
>
|
||||
<GitHubIcon className="h-4 w-4 text-current" />
|
||||
Visit Solution
|
||||
</button>
|
||||
</div>
|
||||
</div>
|
||||
</div>
|
||||
);
|
||||
})}
|
||||
</div>
|
||||
|
||||
{(solutions?.totalPages || 0) > 1 && (
|
||||
|
||||
@@ -1,17 +1,20 @@
|
||||
import { ArrowUpRight, ThumbsDown, ThumbsUp } from 'lucide-react';
|
||||
import { useEffect, useState } from 'react';
|
||||
import { useToast } from '../../hooks/use-toast';
|
||||
import { deleteUrlParam, getUrlParams } from '../../lib/browser';
|
||||
import { getRelativeTimeString } from '../../lib/date';
|
||||
import { ModalLoader } from '../UserProgress/ModalLoader';
|
||||
import { Modal } from '../Modal';
|
||||
import { httpGet, httpPost } from '../../lib/http';
|
||||
import {
|
||||
submittedAlternatives,
|
||||
type AllowedVoteType,
|
||||
} from './ListProjectSolutions';
|
||||
import { getRelativeTimeString } from '../../lib/date';
|
||||
import { ArrowUpRight, ThumbsDown, ThumbsUp, Trophy } from 'lucide-react';
|
||||
import { VoteButton } from './VoteButton';
|
||||
import { GitHubIcon } from '../ReactIcons/GitHubIcon';
|
||||
import { isLoggedIn } from '../../lib/jwt';
|
||||
import { showLoginPopup } from '../../lib/popup';
|
||||
import { pageProgressMessage } from '../../stores/page';
|
||||
import { Modal } from '../Modal';
|
||||
import { GitHubIcon } from '../ReactIcons/GitHubIcon';
|
||||
import { ModalLoader } from '../UserProgress/ModalLoader';
|
||||
import { type AllowedVoteType } from './ListProjectSolutions';
|
||||
import { VoteButton } from './VoteButton';
|
||||
import { useToast } from '../../hooks/use-toast';
|
||||
|
||||
type UserProjectSolutionResponse = {
|
||||
id?: string;
|
||||
@@ -132,12 +135,8 @@ export function ProjectSolutionModal(props: ProjectSolutionModalProps) {
|
||||
bodyClassName={'h-auto'}
|
||||
>
|
||||
<div className="relative p-6">
|
||||
<h1 className="mb-1 text-balance text-2xl font-bold text-gray-900">
|
||||
{projectTitle}
|
||||
</h1>
|
||||
<p className="text-balance text-sm text-gray-600">
|
||||
{projectDescription}
|
||||
</p>
|
||||
<h1 className="text-2xl text-balance mb-1 font-bold text-gray-900">{projectTitle}</h1>
|
||||
<p className="text-sm text-balance text-gray-600">{projectDescription}</p>
|
||||
|
||||
<div className="my-5 rounded-lg bg-gray-100 p-4">
|
||||
<div className="flex items-center gap-3">
|
||||
@@ -151,9 +150,7 @@ export function ProjectSolutionModal(props: ProjectSolutionModalProps) {
|
||||
className="h-12 w-12 rounded-full border-2 border-white shadow-md"
|
||||
/>
|
||||
<div>
|
||||
<h2 className="text-lg font-semibold text-gray-900">
|
||||
{solution?.user.name}'s Solution
|
||||
</h2>
|
||||
<h2 className="text-lg font-semibold text-gray-900">{solution?.user.name}'s Solution</h2>
|
||||
<p className="text-sm text-gray-600">
|
||||
Submitted their solution{' '}
|
||||
{getRelativeTimeString(solution?.submittedAt!)}
|
||||
|
||||
@@ -1,137 +0,0 @@
|
||||
import { ThumbsDown, ThumbsUp } from 'lucide-react';
|
||||
import { getRelativeTimeString } from '../../lib/date';
|
||||
import { VoteButton } from './VoteButton';
|
||||
import { GitHubIcon } from '../ReactIcons/GitHubIcon';
|
||||
import type {
|
||||
AllowedVoteType,
|
||||
ProjectStatusDocument,
|
||||
} from './ListProjectSolutions';
|
||||
|
||||
export const submittedAlternatives = [
|
||||
'submitted their solution',
|
||||
'got it done',
|
||||
'submitted their take',
|
||||
'finished the project',
|
||||
'submitted their work',
|
||||
'completed the project',
|
||||
'got it done',
|
||||
'delivered their project',
|
||||
'handed in their solution',
|
||||
'provided their deliverables',
|
||||
'submitted their approach',
|
||||
'sent in their project',
|
||||
'presented their take',
|
||||
'shared their completed task',
|
||||
'submitted their approach',
|
||||
'completed it',
|
||||
'finalized their solution',
|
||||
'delivered their approach',
|
||||
'turned in their project',
|
||||
'submitted their final draft',
|
||||
'delivered their solution',
|
||||
];
|
||||
|
||||
type ProjectSolutionRowProps = {
|
||||
solution: ProjectStatusDocument & {
|
||||
user: {
|
||||
id: string;
|
||||
name: string;
|
||||
avatar: string;
|
||||
};
|
||||
voteType?: AllowedVoteType | 'none';
|
||||
};
|
||||
counter: number;
|
||||
onVote: (solutionId: string, voteType: AllowedVoteType) => void;
|
||||
onVisitSolution: (solution: ProjectSolutionRowProps['solution']) => void;
|
||||
onLanguageClick?: (language: string) => void;
|
||||
};
|
||||
|
||||
export function ProjectSolutionRow(props: ProjectSolutionRowProps) {
|
||||
const { solution, counter, onVote, onVisitSolution, onLanguageClick } = props;
|
||||
|
||||
const avatar = solution.user.avatar || '';
|
||||
|
||||
return (
|
||||
<div className="group flex flex-col border-gray-100 px-3 py-2.5 text-sm hover:bg-gray-50/50 sm:flex-row sm:justify-between">
|
||||
<div className="flex min-w-0 items-start gap-3">
|
||||
<img
|
||||
src={
|
||||
avatar
|
||||
? `${import.meta.env.PUBLIC_AVATAR_BASE_URL}/${avatar}`
|
||||
: '/images/default-avatar.png'
|
||||
}
|
||||
alt={solution.user.name}
|
||||
className="h-7 w-7 flex-shrink-0 rounded-full sm:h-8 sm:w-8"
|
||||
/>
|
||||
<div className="min-w-0 flex-auto">
|
||||
<div className="flex flex-wrap items-baseline gap-x-1.5 gap-y-0.5">
|
||||
<span className="max-w-[150px] truncate font-medium text-gray-900 sm:max-w-[180px]">
|
||||
{solution.user.name}
|
||||
</span>
|
||||
<span className="hidden truncate text-xs text-gray-500 sm:block sm:text-sm">
|
||||
{submittedAlternatives[counter % submittedAlternatives.length] ||
|
||||
'submitted their solution'}
|
||||
</span>
|
||||
<span
|
||||
className="text-xs text-gray-400"
|
||||
title={new Date(solution?.submittedAt!).toLocaleString()}
|
||||
>
|
||||
· {getRelativeTimeString(solution?.submittedAt!)}
|
||||
</span>
|
||||
</div>
|
||||
|
||||
<div className="mt-2.5 flex gap-1.5">
|
||||
<div className="flex gap-1">
|
||||
<span className="flex shrink-0 overflow-hidden rounded-full border">
|
||||
<VoteButton
|
||||
icon={ThumbsUp}
|
||||
isActive={solution?.voteType === 'upvote'}
|
||||
count={solution.upvotes || 0}
|
||||
onClick={() => {
|
||||
onVote(solution._id!, 'upvote');
|
||||
}}
|
||||
/>
|
||||
|
||||
<VoteButton
|
||||
icon={ThumbsDown}
|
||||
isActive={solution?.voteType === 'downvote'}
|
||||
count={solution.downvotes || 0}
|
||||
hideCount={true}
|
||||
onClick={() => {
|
||||
onVote(solution._id!, 'downvote');
|
||||
}}
|
||||
/>
|
||||
</span>
|
||||
</div>
|
||||
|
||||
<button
|
||||
className="flex items-center gap-1 rounded-full border px-2 py-1 text-xs text-black transition-colors hover:border-black hover:bg-black hover:text-white"
|
||||
onClick={() => {
|
||||
onVisitSolution(solution);
|
||||
}}
|
||||
>
|
||||
<GitHubIcon className="h-3.5 w-3.5 text-current" />
|
||||
<span>Visit Solution</span>
|
||||
</button>
|
||||
</div>
|
||||
</div>
|
||||
</div>
|
||||
|
||||
<div className="mt-2.5 hidden sm:mt-0 sm:block sm:pl-4">
|
||||
{solution.languages && solution.languages.length > 0 && (
|
||||
<div className="flex flex-wrap items-center gap-1.5">
|
||||
{solution.languages.slice(0, 2).map((lang) => (
|
||||
<button
|
||||
key={lang}
|
||||
onClick={() => onLanguageClick?.(lang)}
|
||||
className="inline-flex items-center rounded-md border border-gray-200 bg-white px-2 py-0.5 text-xs font-medium text-gray-700 transition-colors hover:border-gray-300 hover:bg-gray-50 hover:text-gray-900"
|
||||
>
|
||||
{lang}
|
||||
</button>
|
||||
))}
|
||||
</div>
|
||||
)}
|
||||
</div>
|
||||
</div>
|
||||
);
|
||||
}
|
||||
@@ -2,7 +2,7 @@ import { useEffect, useRef, useState } from 'react';
|
||||
import { useOutsideClick } from '../../hooks/use-outside-click';
|
||||
import { httpGet } from '../../lib/http';
|
||||
import { useToast } from '../../hooks/use-toast';
|
||||
import { ChevronDown, Search, X } from 'lucide-react';
|
||||
import { ChevronDown, X } from 'lucide-react';
|
||||
|
||||
type SelectLanguagesProps = {
|
||||
projectId: string;
|
||||
@@ -14,44 +14,10 @@ export function SelectLanguages(props: SelectLanguagesProps) {
|
||||
const { projectId, onSelectLanguage, selectedLanguage } = props;
|
||||
|
||||
const dropdownRef = useRef<HTMLDivElement>(null);
|
||||
const searchInputRef = useRef<HTMLInputElement>(null);
|
||||
const optionsRef = useRef<HTMLDivElement>(null);
|
||||
const toast = useToast();
|
||||
|
||||
const [distinctLanguages, setDistinctLanguages] = useState<string[]>([]);
|
||||
const [isOpen, setIsOpen] = useState(false);
|
||||
const [searchQuery, setSearchQuery] = useState('');
|
||||
const [highlightedIndex, setHighlightedIndex] = useState(0);
|
||||
|
||||
const filteredLanguages = distinctLanguages.filter((language) =>
|
||||
language.toLowerCase().includes(searchQuery.toLowerCase()),
|
||||
);
|
||||
|
||||
// Handle scrolling of highlighted option into view
|
||||
useEffect(() => {
|
||||
if (!isOpen || !optionsRef.current) {
|
||||
return;
|
||||
}
|
||||
|
||||
const options = optionsRef.current.getElementsByTagName('button');
|
||||
const highlightedOption = options[highlightedIndex];
|
||||
if (!highlightedOption) {
|
||||
return;
|
||||
}
|
||||
|
||||
const containerRect = optionsRef.current.getBoundingClientRect();
|
||||
const optionRect = highlightedOption.getBoundingClientRect();
|
||||
|
||||
const isAbove = optionRect.top < containerRect.top;
|
||||
const isBelow = optionRect.bottom > containerRect.bottom;
|
||||
|
||||
if (isAbove || isBelow) {
|
||||
highlightedOption.scrollIntoView({
|
||||
block: 'nearest',
|
||||
behavior: 'instant',
|
||||
});
|
||||
}
|
||||
}, [highlightedIndex, isOpen]);
|
||||
|
||||
const loadDistinctLanguages = async () => {
|
||||
const { response, error } = await httpGet<string[]>(
|
||||
@@ -68,124 +34,53 @@ export function SelectLanguages(props: SelectLanguagesProps) {
|
||||
|
||||
useOutsideClick(dropdownRef, () => {
|
||||
setIsOpen(false);
|
||||
setSearchQuery('');
|
||||
setHighlightedIndex(0);
|
||||
});
|
||||
|
||||
useEffect(() => {
|
||||
loadDistinctLanguages().finally(() => {});
|
||||
}, []);
|
||||
|
||||
useEffect(() => {
|
||||
if (isOpen && searchInputRef.current) {
|
||||
searchInputRef.current.focus();
|
||||
}
|
||||
}, [isOpen]);
|
||||
|
||||
const handleKeyDown = (e: React.KeyboardEvent) => {
|
||||
switch (e.key) {
|
||||
case 'ArrowDown':
|
||||
e.preventDefault();
|
||||
setHighlightedIndex((prev) =>
|
||||
prev >= filteredLanguages.length - 1 ? 0 : prev + 1,
|
||||
);
|
||||
break;
|
||||
case 'ArrowUp':
|
||||
e.preventDefault();
|
||||
setHighlightedIndex((prev) =>
|
||||
prev <= 0 ? filteredLanguages.length - 1 : prev - 1,
|
||||
);
|
||||
break;
|
||||
case 'Enter':
|
||||
e.preventDefault();
|
||||
if (filteredLanguages[highlightedIndex]) {
|
||||
onSelectLanguage(filteredLanguages[highlightedIndex]);
|
||||
setIsOpen(false);
|
||||
setSearchQuery('');
|
||||
setHighlightedIndex(0);
|
||||
}
|
||||
break;
|
||||
case 'Escape':
|
||||
setIsOpen(false);
|
||||
setSearchQuery('');
|
||||
setHighlightedIndex(0);
|
||||
break;
|
||||
}
|
||||
};
|
||||
|
||||
return (
|
||||
<div className="relative flex flex-shrink-0">
|
||||
<div className="relative">
|
||||
<div className="relative flex">
|
||||
<button
|
||||
className="flex items-center gap-1 rounded-md border border-gray-300 py-1.5 pl-3 pr-2 text-xs font-medium text-gray-900"
|
||||
onClick={() => setIsOpen(!isOpen)}
|
||||
>
|
||||
{selectedLanguage || 'Select Language'}
|
||||
|
||||
<ChevronDown className="ml-1 h-4 w-4" />
|
||||
</button>
|
||||
{selectedLanguage && (
|
||||
<button
|
||||
className="flex items-center gap-1 rounded-md border border-gray-300 py-1.5 pl-3 pr-2 text-xs font-medium text-gray-900"
|
||||
onClick={() => setIsOpen(!isOpen)}
|
||||
className="ml-1 text-red-500 text-xs border border-red-500 rounded-md px-2 py-1"
|
||||
onClick={() => onSelectLanguage('')}
|
||||
>
|
||||
{selectedLanguage || 'Select Language'}
|
||||
<ChevronDown className="ml-1 h-4 w-4" />
|
||||
Clear
|
||||
</button>
|
||||
{selectedLanguage && (
|
||||
<button
|
||||
className="absolute -right-1.5 -top-1.5 flex h-4 w-4 items-center justify-center rounded-full bg-red-500 text-white hover:bg-red-600"
|
||||
onClick={(e) => {
|
||||
e.stopPropagation();
|
||||
onSelectLanguage('');
|
||||
}}
|
||||
>
|
||||
<X className="size-3" strokeWidth={2.5} />
|
||||
<span className="sr-only">Clear selection</span>
|
||||
</button>
|
||||
)}
|
||||
</div>
|
||||
)}
|
||||
|
||||
{isOpen && (
|
||||
<div
|
||||
className="absolute right-0 top-full z-10 w-full min-w-[200px] max-w-[200px] translate-y-1.5 overflow-hidden rounded-md border border-gray-300 bg-white p-1 shadow-lg"
|
||||
ref={dropdownRef}
|
||||
onKeyDown={handleKeyDown}
|
||||
>
|
||||
<div className="relative mb-1 px-1">
|
||||
<Search className="absolute left-3 top-1/2 h-4 w-4 -translate-y-1/2 text-gray-400" />
|
||||
<input
|
||||
ref={searchInputRef}
|
||||
type="text"
|
||||
className="w-full rounded-md border border-gray-200 py-1.5 pl-9 pr-3 text-sm focus:border-gray-300 focus:outline-none"
|
||||
placeholder="Search languages..."
|
||||
value={searchQuery}
|
||||
onChange={(e) => {
|
||||
setSearchQuery(e.target.value);
|
||||
setHighlightedIndex(0);
|
||||
}}
|
||||
/>
|
||||
</div>
|
||||
<div ref={optionsRef} className="max-h-[200px] overflow-y-auto">
|
||||
{filteredLanguages.map((language, index) => {
|
||||
const isSelected = selectedLanguage === language;
|
||||
const isHighlighted = index === highlightedIndex;
|
||||
{distinctLanguages.map((language) => {
|
||||
const isSelected = selectedLanguage === language;
|
||||
|
||||
return (
|
||||
<button
|
||||
key={language}
|
||||
className={`flex w-full items-center rounded-md px-4 py-1.5 text-left text-sm text-gray-700 hover:bg-gray-100 aria-selected:bg-gray-100 ${
|
||||
isHighlighted ? 'bg-gray-100' : ''
|
||||
}`}
|
||||
onClick={() => {
|
||||
onSelectLanguage(language);
|
||||
setIsOpen(false);
|
||||
setSearchQuery('');
|
||||
setHighlightedIndex(0);
|
||||
}}
|
||||
aria-selected={isSelected}
|
||||
>
|
||||
{language}
|
||||
</button>
|
||||
);
|
||||
})}
|
||||
{filteredLanguages.length === 0 && (
|
||||
<div className="px-4 py-2 text-sm text-gray-500">
|
||||
No languages found
|
||||
</div>
|
||||
)}
|
||||
</div>
|
||||
return (
|
||||
<button
|
||||
key={language}
|
||||
className="flex w-full items-center rounded-md px-4 py-1.5 text-left text-sm text-gray-700 hover:bg-gray-100 aria-selected:bg-gray-100"
|
||||
onClick={() => {
|
||||
onSelectLanguage(language);
|
||||
setIsOpen(false);
|
||||
}}
|
||||
aria-selected={isSelected}
|
||||
>
|
||||
{language}
|
||||
</button>
|
||||
);
|
||||
})}
|
||||
</div>
|
||||
)}
|
||||
</div>
|
||||
|
||||
@@ -1,66 +0,0 @@
|
||||
import { useRef, useState } from 'react';
|
||||
import { useOutsideClick } from '../../hooks/use-outside-click';
|
||||
import { ChevronDown } from 'lucide-react';
|
||||
|
||||
type SortOption = {
|
||||
label: string;
|
||||
value: string;
|
||||
};
|
||||
|
||||
const sortOptions: SortOption[] = [
|
||||
{ label: 'Latest First', value: 'latest' },
|
||||
{ label: 'Oldest First', value: 'oldest' },
|
||||
{ label: 'Highest Rating', value: 'rating' },
|
||||
];
|
||||
|
||||
type SortProjectsProps = {
|
||||
selectedSort: string;
|
||||
onSelectSort: (sort: string) => void;
|
||||
};
|
||||
|
||||
export function SortProjects(props: SortProjectsProps) {
|
||||
const { selectedSort, onSelectSort } = props;
|
||||
const [isOpen, setIsOpen] = useState(false);
|
||||
const dropdownRef = useRef<HTMLDivElement>(null);
|
||||
|
||||
useOutsideClick(dropdownRef, () => {
|
||||
setIsOpen(false);
|
||||
});
|
||||
|
||||
const selectedOption =
|
||||
sortOptions.find((option) => option.value === selectedSort) ||
|
||||
sortOptions[0];
|
||||
|
||||
return (
|
||||
<div className="relative flex-shrink-0" ref={dropdownRef}>
|
||||
<button
|
||||
className="flex items-center gap-1 rounded-md border border-gray-300 py-1.5 pl-3 pr-2 text-xs font-medium text-gray-900"
|
||||
onClick={() => setIsOpen(!isOpen)}
|
||||
>
|
||||
{selectedOption.label}
|
||||
<ChevronDown className="ml-1 h-4 w-4" />
|
||||
</button>
|
||||
|
||||
{isOpen && (
|
||||
<div className="absolute right-0 top-full z-10 mt-1.5 min-w-[150px] overflow-hidden rounded-md border border-gray-300 bg-white shadow-lg">
|
||||
<div className="py-1">
|
||||
{sortOptions.map((option) => (
|
||||
<button
|
||||
key={option.value}
|
||||
className={`flex w-full items-center px-4 py-1.5 text-left text-sm text-gray-700 hover:bg-gray-100 ${
|
||||
selectedSort === option.value ? 'bg-gray-100' : ''
|
||||
}`}
|
||||
onClick={() => {
|
||||
onSelectSort(option.value);
|
||||
setIsOpen(false);
|
||||
}}
|
||||
>
|
||||
{option.label}
|
||||
</button>
|
||||
))}
|
||||
</div>
|
||||
</div>
|
||||
)}
|
||||
</div>
|
||||
);
|
||||
}
|
||||
@@ -287,32 +287,28 @@ export function ProjectStepper(props: ProjectStepperProps) {
|
||||
number={2}
|
||||
/>
|
||||
|
||||
{activeStep > 1 && (
|
||||
<>
|
||||
<span className="text-gray-600 sm:hidden">·</span>
|
||||
<button
|
||||
className={cn(
|
||||
'flex items-center gap-2 text-sm sm:hidden',
|
||||
isCopied ? 'text-green-500' : 'text-gray-600',
|
||||
)}
|
||||
onClick={() => {
|
||||
copyText(projectSolutionUrl);
|
||||
}}
|
||||
>
|
||||
{isCopied ? (
|
||||
<>
|
||||
<CheckIcon additionalClasses="h-3 w-3" />
|
||||
URL Copied
|
||||
</>
|
||||
) : (
|
||||
<>
|
||||
<Share className="h-3 w-3 stroke-[2.5px]" />
|
||||
Share your Solution
|
||||
</>
|
||||
)}
|
||||
</button>
|
||||
</>
|
||||
)}
|
||||
<span className="text-gray-600 sm:hidden">·</span>
|
||||
<button
|
||||
className={cn(
|
||||
'flex items-center gap-2 text-sm sm:hidden',
|
||||
isCopied ? 'text-green-500' : 'text-gray-600',
|
||||
)}
|
||||
onClick={() => {
|
||||
copyText(projectSolutionUrl);
|
||||
}}
|
||||
>
|
||||
{isCopied ? (
|
||||
<>
|
||||
<CheckIcon additionalClasses="h-3 w-3" />
|
||||
URL Copied
|
||||
</>
|
||||
) : (
|
||||
<>
|
||||
<Share className="h-3 w-3 stroke-[2.5px]" />
|
||||
Share your Solution
|
||||
</>
|
||||
)}
|
||||
</button>
|
||||
</div>
|
||||
<StepperStepSeparator isActive={activeStep > 1} />
|
||||
<MilestoneStep
|
||||
|
||||
@@ -103,7 +103,7 @@ export function QuestionCard(props: QuestionCardProps) {
|
||||
|
||||
{question.isLongAnswer && (
|
||||
<div
|
||||
className={`qa-answer prose prose-h5:font-semibold prose-h5:mb-2 prose-h5:text-black prose-sm prose-quoteless mx-auto flex w-full max-w-[600px] flex-grow flex-col items-start justify-center py-0 px-4 text-left text-sm prose-h1:mb-2.5 prose-h1:mt-7 prose-h2:mb-3 prose-h2:mt-0 prose-h3:mb-[5px] prose-h3:mt-[10px] prose-p:mb-2 prose-p:mt-0 prose-blockquote:font-normal prose-blockquote:not-italic prose-blockquote:text-gray-700 prose-pre:!mb-6 prose-pre:w-full prose-ul:my-2 prose-li:m-0 prose-li:mb-0.5 sm:px-5 sm:text-lg sm:prose-p:mb-4`}
|
||||
className={`qa-answer prose prose-sm prose-quoteless mx-auto flex w-full max-w-[600px] flex-grow flex-col items-start justify-center py-0 px-4 text-left text-sm prose-h1:mb-2.5 prose-h1:mt-7 prose-h2:mb-3 prose-h2:mt-0 prose-h3:mb-[5px] prose-h3:mt-[10px] prose-p:mb-2 prose-p:mt-0 prose-blockquote:font-normal prose-blockquote:not-italic prose-blockquote:text-gray-700 prose-pre:!mb-6 prose-pre:w-full prose-ul:my-2 prose-li:m-0 prose-li:mb-0.5 sm:px-5 sm:text-lg sm:prose-p:mb-4`}
|
||||
dangerouslySetInnerHTML={{
|
||||
__html: markdownToHtml(question.answer, false),
|
||||
}}
|
||||
|
||||
@@ -149,11 +149,6 @@ const { frontmatter: guideFrontmatter, author } = questionGroup;
|
||||
</div>
|
||||
))
|
||||
}
|
||||
{questionGroup.ending && (
|
||||
<div class='mb-5'>
|
||||
<div set:html={markdownToHtml(questionGroup.ending, false)} />
|
||||
</div>
|
||||
)}
|
||||
</MarkdownFile>
|
||||
</div>
|
||||
</article>
|
||||
|
||||
@@ -1,20 +0,0 @@
|
||||
import { cn } from '../../lib/classname';
|
||||
|
||||
interface HackerNewsIconProps {
|
||||
className?: string;
|
||||
}
|
||||
|
||||
export function HackerNewsIcon(props: HackerNewsIconProps) {
|
||||
const { className } = props;
|
||||
|
||||
return (
|
||||
<svg
|
||||
xmlns="http://www.w3.org/2000/svg"
|
||||
viewBox="0 0 448 512"
|
||||
fill="currentColor"
|
||||
className={cn('h-[26px] w-[26px]', className)}
|
||||
>
|
||||
<path d="M400 32H48C21.5 32 0 53.5 0 80v352c0 26.5 21.5 48 48 48h352c26.5 0 48-21.5 48-48V80c0-26.5-21.5-48-48-48zM21.2 229.2H21c.1-.1.2-.3.3-.4 0 .1 0 .3-.1.4zm218 53.9V384h-31.4V281.3L128 128h37.3c52.5 98.3 49.2 101.2 59.3 125.6 12.3-27 5.8-24.4 60.6-125.6H320l-80.8 155.1z" />
|
||||
</svg>
|
||||
);
|
||||
}
|
||||
@@ -1,20 +0,0 @@
|
||||
import { cn } from '../../lib/classname';
|
||||
|
||||
interface RedditIconProps {
|
||||
className?: string;
|
||||
}
|
||||
|
||||
export function RedditIcon(props: RedditIconProps) {
|
||||
const { className } = props;
|
||||
|
||||
return (
|
||||
<svg
|
||||
xmlns="http://www.w3.org/2000/svg"
|
||||
viewBox="0 0 448 512"
|
||||
fill="currentColor"
|
||||
className={cn('h-[26px] w-[26px]', className)}
|
||||
>
|
||||
<path d="M283.2 345.5c2.7 2.7 2.7 6.8 0 9.2-24.5 24.5-93.8 24.6-118.4 0-2.7-2.4-2.7-6.5 0-9.2 2.4-2.4 6.5-2.4 8.9 0 18.7 19.2 81 19.6 100.5 0 2.4-2.3 6.6-2.3 9 0zm-91.3-53.8c0-14.9-11.9-26.8-26.5-26.8a26.67 26.67 0 0 0-26.8 26.8c0 14.6 11.9 26.5 26.8 26.5 14.6 0 26.5-11.9 26.5-26.5zm90.7-26.8c-14.6 0-26.5 11.9-26.5 26.8 0 14.6 11.9 26.5 26.5 26.5 14.9 0 26.8-11.9 26.8-26.5a26.67 26.67 0 0 0-26.8-26.8zM448 80v352c0 26.5-21.5 48-48 48H48c-26.5 0-48-21.5-48-48V80c0-26.5 21.5-48 48-48h352c26.5 0 48 21.5 48 48zm-99.7 140.6c-10.1 0-19 4.2-25.6 10.7-24.1-16.7-56.5-27.4-92.5-28.6l18.7-84.2 59.5 13.4c0 14.6 11.9 26.5 26.5 26.5 14.9 0 26.8-12.2 26.8-26.8s-11.9-26.8-26.8-26.8c-10.4 0-19.3 6.2-23.8 14.9l-65.7-14.6c-3.3-.9-6.5 1.5-7.4 4.8l-20.5 92.8c-35.7 1.5-67.8 12.2-91.9 28.9-6.5-6.8-15.8-11-25.9-11-37.5 0-49.8 50.4-15.5 67.5-1.2 5.4-1.8 11-1.8 16.7 0 56.5 63.7 102.3 141.9 102.3 78.5 0 142.2-45.8 142.2-102.3 0-5.7-.6-11.6-2.1-17 33.6-17.2 21.2-67.2-16.1-67.2z" />
|
||||
</svg>
|
||||
);
|
||||
}
|
||||
@@ -1,28 +0,0 @@
|
||||
import type { SVGProps } from 'react';
|
||||
|
||||
type RoadmapLogoIconProps = SVGProps<SVGSVGElement> & {
|
||||
color?: 'white' | 'black';
|
||||
};
|
||||
|
||||
export function RoadmapLogoIcon(props: RoadmapLogoIconProps) {
|
||||
const { color = 'white', ...rest } = props;
|
||||
|
||||
return (
|
||||
<svg
|
||||
xmlns="http://www.w3.org/2000/svg"
|
||||
width="30"
|
||||
height="30"
|
||||
viewBox="0 0 283 283"
|
||||
{...rest}
|
||||
>
|
||||
<path
|
||||
fill={color === 'black' ? '#000' : '#fff'}
|
||||
d="M0 39C0 17.46 17.46 0 39 0h205c21.539 0 39 17.46 39 39v205c0 21.539-17.461 39-39 39H39c-21.54 0-39-17.461-39-39V39Z"
|
||||
/>
|
||||
<path
|
||||
fill={color === 'black' ? '#fff' : '#000'}
|
||||
d="M121.215 210.72c-1.867.56-4.854 1.12-8.96 1.68-3.92.56-8.027.84-12.32.84-4.107 0-7.84-.28-11.2-.84-3.174-.56-5.88-1.68-8.12-3.36s-4.014-3.92-5.32-6.72c-1.12-2.987-1.68-6.813-1.68-11.48v-84c0-4.293.746-7.933 2.24-10.92 1.68-3.173 4.013-5.973 7-8.4s6.626-4.573 10.92-6.44c4.48-2.053 9.24-3.827 14.28-5.32a106.176 106.176 0 0 1 15.68-3.36 95.412 95.412 0 0 1 16.24-1.4c8.96 0 16.053 1.773 21.28 5.32 5.226 3.36 7.84 8.96 7.84 16.8 0 2.613-.374 5.227-1.12 7.84-.747 2.427-1.68 4.667-2.8 6.72a133.1 133.1 0 0 0-12.04.56c-4.107.373-8.12.933-12.04 1.68s-7.654 1.587-11.2 2.52c-3.36.747-6.254 1.68-8.68 2.8v95.48zm45.172-22.4c0-7.84 2.426-14.373 7.28-19.6s11.48-7.84 19.88-7.84 15.026 2.613 19.88 7.84 7.28 11.76 7.28 19.6-2.427 14.373-7.28 19.6-11.48 7.84-19.88 7.84-15.027-2.613-19.88-7.84-7.28-11.76-7.28-19.6z"
|
||||
/>
|
||||
</svg>
|
||||
);
|
||||
}
|
||||
@@ -18,7 +18,7 @@ export function TwitterIcon(props: TwitterIconProps) {
|
||||
<rect width="23" height="23" rx="3" fill={boxColor} />
|
||||
<path
|
||||
d="M12.9285 10.3522L18.5135 4H17.1905L12.339 9.5144L8.467 4H4L9.8565 12.3395L4 19H5.323L10.443 13.1754L14.533 19H19M5.8005 4.97619H7.833L17.1895 18.0718H15.1565"
|
||||
fill="currentColor"
|
||||
fill='currentColor'
|
||||
/>
|
||||
</svg>
|
||||
);
|
||||
|
||||
@@ -1,8 +1,8 @@
|
||||
import { httpGet } from '../../lib/http';
|
||||
import { useEffect, useState } from 'react';
|
||||
import { pageProgressMessage } from '../../stores/page';
|
||||
import type { UserProgressResponse } from '../HeroSection/FavoriteRoadmaps';
|
||||
import { SelectionButton } from './SelectionButton';
|
||||
import type { UserProgressResponse } from '../Roadmaps/RoadmapsPage';
|
||||
|
||||
type RoadmapSelectProps = {
|
||||
selectedRoadmaps: string[];
|
||||
|
||||
@@ -17,7 +17,7 @@ const links = [
|
||||
isHighlighted: true,
|
||||
},
|
||||
{
|
||||
link: '/ai',
|
||||
link: '/ai/explore',
|
||||
label: 'AI Roadmaps',
|
||||
description: 'Generate roadmaps with AI',
|
||||
Icon: Sparkles,
|
||||
@@ -64,7 +64,7 @@ export function RoadmapDropdownMenu() {
|
||||
</button>
|
||||
<div
|
||||
className={cn(
|
||||
'pointer-events-none invisible absolute left-0 top-full z-[90] mt-2 w-48 min-w-[320px] -translate-y-1 rounded-lg bg-slate-800 py-2 opacity-0 shadow-2xl transition-all duration-100',
|
||||
'pointer-events-none invisible absolute left-0 top-full z-[999] mt-2 w-48 min-w-[320px] -translate-y-1 rounded-lg bg-slate-800 py-2 opacity-0 shadow-2xl transition-all duration-100',
|
||||
{
|
||||
'pointer-events-auto visible translate-y-2.5 opacity-100':
|
||||
$roadmapsDropdownOpen,
|
||||
|
||||
@@ -13,7 +13,7 @@ import { MarkFavorite } from './FeaturedItems/MarkFavorite';
|
||||
import { type RoadmapFrontmatter } from '../lib/roadmap';
|
||||
import { ShareRoadmapButton } from './ShareRoadmapButton';
|
||||
import { DownloadRoadmapButton } from './DownloadRoadmapButton';
|
||||
import { CourseAnnouncement } from './SQLCourse/CourseAnnouncement';
|
||||
|
||||
export interface Props {
|
||||
title: string;
|
||||
description: string;
|
||||
|
||||
@@ -10,27 +10,8 @@ import {
|
||||
} from '../../lib/browser.ts';
|
||||
import { RoadmapCard } from './RoadmapCard.tsx';
|
||||
import { httpGet } from '../../lib/http.ts';
|
||||
import type { UserProgressResponse } from '../HeroSection/FavoriteRoadmaps.tsx';
|
||||
import { isLoggedIn } from '../../lib/jwt.ts';
|
||||
import type { AllowedMemberRoles } from '../ShareOptions/ShareTeamMemberList.tsx';
|
||||
|
||||
export type UserProgressResponse = {
|
||||
resourceId: string;
|
||||
resourceType: 'roadmap' | 'best-practice';
|
||||
resourceTitle: string;
|
||||
isFavorite: boolean;
|
||||
done: number;
|
||||
learning: number;
|
||||
skipped: number;
|
||||
total: number;
|
||||
updatedAt: Date;
|
||||
isCustomResource: boolean;
|
||||
roadmapSlug?: string;
|
||||
team?: {
|
||||
name: string;
|
||||
id: string;
|
||||
role: AllowedMemberRoles;
|
||||
};
|
||||
}[];
|
||||
|
||||
const groupNames = [
|
||||
'Absolute Beginners',
|
||||
|
||||
@@ -1,67 +0,0 @@
|
||||
import { useQuery } from '@tanstack/react-query';
|
||||
import { useEffect, useState } from 'react';
|
||||
import { isLoggedIn } from '../../lib/jwt';
|
||||
import {
|
||||
courseProgressOptions
|
||||
} from '../../queries/course-progress';
|
||||
import { queryClient } from '../../stores/query-client';
|
||||
import { CourseLoginPopup } from '../AuthenticationFlow/CourseLoginPopup';
|
||||
import { BuyButton, SQL_COURSE_SLUG } from './BuyButton';
|
||||
|
||||
export function AccountButton() {
|
||||
const [isVisible, setIsVisible] = useState(false);
|
||||
const [showLoginModal, setShowLoginModal] = useState(false);
|
||||
|
||||
const { data: courseProgress, isLoading: isLoadingCourseProgress } = useQuery(
|
||||
courseProgressOptions(SQL_COURSE_SLUG),
|
||||
queryClient,
|
||||
);
|
||||
|
||||
useEffect(() => {
|
||||
setIsVisible(true);
|
||||
}, []);
|
||||
|
||||
const buttonClasses =
|
||||
'rounded-full px-5 py-2 text-base font-medium text-yellow-700 hover:text-yellow-500 transition-colors';
|
||||
|
||||
const hasEnrolled = !!courseProgress?.enrolledAt;
|
||||
const loginModal = (
|
||||
<CourseLoginPopup
|
||||
checkoutAfterLogin={false}
|
||||
onClose={() => {
|
||||
setShowLoginModal(false);
|
||||
}}
|
||||
/>
|
||||
);
|
||||
|
||||
if (!isVisible || isLoadingCourseProgress) {
|
||||
return <button className={`${buttonClasses} opacity-0`}>...</button>;
|
||||
}
|
||||
|
||||
if (!isLoggedIn()) {
|
||||
return (
|
||||
<>
|
||||
<button
|
||||
onClick={() => setShowLoginModal(true)}
|
||||
className={`${buttonClasses} animate-fade-in`}
|
||||
>
|
||||
Login
|
||||
</button>
|
||||
{showLoginModal && loginModal}
|
||||
</>
|
||||
);
|
||||
}
|
||||
|
||||
if (!hasEnrolled) {
|
||||
return <BuyButton variant="top-nav" />;
|
||||
}
|
||||
|
||||
return (
|
||||
<a
|
||||
href={`${import.meta.env.PUBLIC_COURSE_APP_URL}/${SQL_COURSE_SLUG}`}
|
||||
className={`${buttonClasses} animate-fade-in`}
|
||||
>
|
||||
Start Learning
|
||||
</a>
|
||||
);
|
||||
}
|
||||
@@ -1,40 +0,0 @@
|
||||
import { QuoteIcon } from 'lucide-react';
|
||||
|
||||
export function AuthorQuoteMessage() {
|
||||
return (
|
||||
<div className="mx-auto mt-14 max-w-2xl sm:mt-20">
|
||||
<div className="relative overflow-hidden rounded-2xl bg-gradient-to-br from-yellow-500/10 via-yellow-400/5 to-yellow-300/10 p-6 sm:p-10">
|
||||
<div className="relative">
|
||||
<p className="mb-6 text-base sm:text-xl leading-relaxed text-zinc-200">
|
||||
"As someone who has worked extensively with databases throughout my
|
||||
career, I know firsthand how crucial SQL skills are. I've created
|
||||
this course to share the practical knowledge that has helped me
|
||||
build and scale data systems at various companies."
|
||||
</p>
|
||||
|
||||
<div className="flex items-center gap-4 border-t border-yellow-500/20 pt-6">
|
||||
<img
|
||||
src="https://assets.roadmap.sh/guest/kamran-lqjta.jpeg"
|
||||
alt="Kamran Ahmed"
|
||||
className="size-14 rounded-full ring-2 ring-yellow-500/20"
|
||||
/>
|
||||
<div>
|
||||
<h3 className="font-medium text-yellow-500">Kamran Ahmed</h3>
|
||||
<p className="text-sm text-zinc-400">
|
||||
Founder roadmap.sh <span className="mx-1 sm:inline hidden">·</span>
|
||||
<a
|
||||
href="https://twitter.com/kamrify"
|
||||
target="_blank"
|
||||
rel="noopener noreferrer"
|
||||
className="ml-0.5 text-yellow-500/80 underline underline-offset-4 hover:text-yellow-500"
|
||||
>
|
||||
@kamrify
|
||||
</a>
|
||||
</p>
|
||||
</div>
|
||||
</div>
|
||||
</div>
|
||||
</div>
|
||||
</div>
|
||||
);
|
||||
}
|
||||
@@ -1,256 +0,0 @@
|
||||
import { useMutation, useQuery } from '@tanstack/react-query';
|
||||
import { ArrowRightIcon } from 'lucide-react';
|
||||
import { useEffect, useState } from 'react';
|
||||
import { cn } from '../../lib/classname';
|
||||
import {
|
||||
COURSE_PURCHASE_PARAM,
|
||||
COURSE_PURCHASE_SUCCESS_PARAM,
|
||||
isLoggedIn,
|
||||
} from '../../lib/jwt';
|
||||
import { coursePriceOptions } from '../../queries/billing';
|
||||
import { courseProgressOptions } from '../../queries/course-progress';
|
||||
import { queryClient } from '../../stores/query-client';
|
||||
import { CourseLoginPopup } from '../AuthenticationFlow/CourseLoginPopup';
|
||||
import { useToast } from '../../hooks/use-toast';
|
||||
import { httpPost } from '../../lib/query-http';
|
||||
import { deleteUrlParam, getUrlParams } from '../../lib/browser';
|
||||
|
||||
export const SQL_COURSE_SLUG = 'sql';
|
||||
|
||||
type CreateCheckoutSessionBody = {
|
||||
courseId: string;
|
||||
success?: string;
|
||||
cancel?: string;
|
||||
};
|
||||
|
||||
type CreateCheckoutSessionResponse = {
|
||||
checkoutUrl: string;
|
||||
};
|
||||
|
||||
type BuyButtonProps = {
|
||||
variant?: 'main' | 'floating' | 'top-nav';
|
||||
};
|
||||
|
||||
export function BuyButton(props: BuyButtonProps) {
|
||||
const { variant = 'main' } = props;
|
||||
|
||||
const [isLoginPopupOpen, setIsLoginPopupOpen] = useState(false);
|
||||
const toast = useToast();
|
||||
|
||||
const { data: coursePricing, isLoading: isLoadingCourse } = useQuery(
|
||||
coursePriceOptions({ courseSlug: SQL_COURSE_SLUG }),
|
||||
queryClient,
|
||||
);
|
||||
|
||||
const { data: courseProgress, isLoading: isLoadingCourseProgress } = useQuery(
|
||||
courseProgressOptions(SQL_COURSE_SLUG),
|
||||
queryClient,
|
||||
);
|
||||
|
||||
const {
|
||||
mutate: createCheckoutSession,
|
||||
isPending: isCreatingCheckoutSession,
|
||||
} = useMutation(
|
||||
{
|
||||
mutationFn: (body: CreateCheckoutSessionBody) => {
|
||||
return httpPost<CreateCheckoutSessionResponse>(
|
||||
'/v1-create-checkout-session',
|
||||
body,
|
||||
);
|
||||
},
|
||||
onMutate: () => {
|
||||
toast.loading('Creating checkout session...');
|
||||
},
|
||||
onSuccess: (data) => {
|
||||
if (!window.gtag) {
|
||||
window.location.href = data.checkoutUrl;
|
||||
return;
|
||||
}
|
||||
|
||||
window?.fireEvent({
|
||||
action: `${SQL_COURSE_SLUG}_begin_checkout`,
|
||||
category: 'course',
|
||||
label: `${SQL_COURSE_SLUG} Course Checkout Started`,
|
||||
callback: () => {
|
||||
window.location.href = data.checkoutUrl;
|
||||
},
|
||||
});
|
||||
|
||||
// Hacky way to make sure that we redirect in case
|
||||
// GA was blocked or not able to redirect the user.
|
||||
setTimeout(() => {
|
||||
window.location.href = data.checkoutUrl;
|
||||
}, 3000);
|
||||
},
|
||||
onError: (error) => {
|
||||
console.error(error);
|
||||
toast.error(error?.message || 'Failed to create checkout session');
|
||||
},
|
||||
},
|
||||
queryClient,
|
||||
);
|
||||
|
||||
useEffect(() => {
|
||||
const urlParams = getUrlParams();
|
||||
const shouldTriggerPurchase = urlParams[COURSE_PURCHASE_PARAM] === '1';
|
||||
if (shouldTriggerPurchase) {
|
||||
deleteUrlParam(COURSE_PURCHASE_PARAM);
|
||||
initPurchase();
|
||||
}
|
||||
}, []);
|
||||
|
||||
useEffect(() => {
|
||||
const urlParams = getUrlParams();
|
||||
const param = urlParams?.[COURSE_PURCHASE_SUCCESS_PARAM];
|
||||
if (!param) {
|
||||
return;
|
||||
}
|
||||
|
||||
const success = param === '1';
|
||||
|
||||
if (success) {
|
||||
window?.fireEvent({
|
||||
action: `${SQL_COURSE_SLUG}_purchase_complete`,
|
||||
category: 'course',
|
||||
label: `${SQL_COURSE_SLUG} Course Purchase Completed`,
|
||||
});
|
||||
} else {
|
||||
window?.fireEvent({
|
||||
action: `${SQL_COURSE_SLUG}_purchase_canceled`,
|
||||
category: 'course',
|
||||
label: `${SQL_COURSE_SLUG} Course Purchase Canceled`,
|
||||
});
|
||||
}
|
||||
|
||||
deleteUrlParam(COURSE_PURCHASE_SUCCESS_PARAM);
|
||||
}, []);
|
||||
|
||||
const isLoadingPricing =
|
||||
isLoadingCourse || !coursePricing || isLoadingCourseProgress;
|
||||
const isAlreadyEnrolled = !!courseProgress?.enrolledAt;
|
||||
|
||||
function initPurchase() {
|
||||
if (!isLoggedIn()) {
|
||||
return;
|
||||
}
|
||||
|
||||
createCheckoutSession({
|
||||
courseId: SQL_COURSE_SLUG,
|
||||
success: `/courses/${SQL_COURSE_SLUG}?${COURSE_PURCHASE_SUCCESS_PARAM}=1`,
|
||||
cancel: `/courses/${SQL_COURSE_SLUG}?${COURSE_PURCHASE_SUCCESS_PARAM}=0`,
|
||||
});
|
||||
}
|
||||
|
||||
function onBuyClick() {
|
||||
if (!isLoggedIn()) {
|
||||
setIsLoginPopupOpen(true);
|
||||
return;
|
||||
}
|
||||
|
||||
const hasEnrolled = !!courseProgress?.enrolledAt;
|
||||
if (hasEnrolled) {
|
||||
window.location.href = `${import.meta.env.PUBLIC_COURSE_APP_URL}/${SQL_COURSE_SLUG}`;
|
||||
return;
|
||||
}
|
||||
|
||||
initPurchase();
|
||||
}
|
||||
|
||||
const courseLoginPopup = isLoginPopupOpen && (
|
||||
<CourseLoginPopup onClose={() => setIsLoginPopupOpen(false)} />
|
||||
);
|
||||
|
||||
if (variant === 'main') {
|
||||
return (
|
||||
<div className="relative flex w-full flex-col items-center gap-2 md:w-auto">
|
||||
{courseLoginPopup}
|
||||
<button
|
||||
onClick={onBuyClick}
|
||||
disabled={isLoadingPricing}
|
||||
className={cn(
|
||||
'group relative inline-flex w-full min-w-[235px] items-center justify-center overflow-hidden rounded-xl bg-gradient-to-r from-yellow-500 to-yellow-300 px-8 py-3 text-base font-semibold text-black transition-all duration-300 ease-out hover:scale-[1.02] hover:shadow-[0_0_30px_rgba(234,179,8,0.4)] focus:outline-none active:ring-0 md:w-auto md:rounded-full md:text-lg',
|
||||
(isLoadingPricing || isCreatingCheckoutSession) &&
|
||||
'striped-loader-yellow pointer-events-none scale-105 bg-yellow-500',
|
||||
)}
|
||||
>
|
||||
{isLoadingPricing ? (
|
||||
<span className="relative flex items-center gap-2"> </span>
|
||||
) : isAlreadyEnrolled ? (
|
||||
<span className="relative flex items-center gap-2">
|
||||
Start Learning
|
||||
</span>
|
||||
) : (
|
||||
<span className="relative flex items-center gap-2">
|
||||
Buy now for{' '}
|
||||
{coursePricing?.isEligibleForDiscount ? (
|
||||
<span className="flex items-center gap-2">
|
||||
<span className="hidden text-base line-through opacity-75 md:inline">
|
||||
${coursePricing?.fullPrice}
|
||||
</span>
|
||||
<span className="text-base md:text-xl">
|
||||
${coursePricing?.regionalPrice}
|
||||
</span>
|
||||
</span>
|
||||
) : (
|
||||
<span>${coursePricing?.regionalPrice}</span>
|
||||
)}
|
||||
<ArrowRightIcon className="h-5 w-5 transition-transform duration-300 ease-out group-hover:translate-x-1" />
|
||||
</span>
|
||||
)}
|
||||
</button>
|
||||
|
||||
{!isLoadingPricing && (
|
||||
<span className="absolute top-full translate-y-2.5 text-sm text-yellow-400">
|
||||
Lifetime access <span className="mx-1">·</span> Free updates
|
||||
</span>
|
||||
)}
|
||||
</div>
|
||||
);
|
||||
}
|
||||
|
||||
if (variant === 'top-nav') {
|
||||
return (
|
||||
<button
|
||||
onClick={onBuyClick}
|
||||
disabled={isLoadingPricing}
|
||||
className={`animate-fade-in rounded-full px-5 py-2 text-base font-medium text-yellow-700 transition-colors hover:text-yellow-500`}
|
||||
>
|
||||
Purchase Course
|
||||
</button>
|
||||
);
|
||||
}
|
||||
|
||||
return (
|
||||
<div className="relative flex flex-col items-center gap-2">
|
||||
{courseLoginPopup}
|
||||
<button
|
||||
onClick={onBuyClick}
|
||||
disabled={isLoadingPricing}
|
||||
className={cn(
|
||||
'group relative inline-flex min-w-[220px] items-center justify-center overflow-hidden rounded-full bg-gradient-to-r from-yellow-500 to-yellow-300 px-8 py-2 font-medium text-black transition-all duration-300 ease-out hover:scale-[1.02] hover:shadow-[0_0_30px_rgba(234,179,8,0.4)] focus:outline-none',
|
||||
(isLoadingPricing || isCreatingCheckoutSession) &&
|
||||
'striped-loader-yellow pointer-events-none bg-yellow-500',
|
||||
)}
|
||||
>
|
||||
{isLoadingPricing ? (
|
||||
<span className="relative flex items-center gap-2"> </span>
|
||||
) : isAlreadyEnrolled ? (
|
||||
<span className="relative flex items-center gap-2">
|
||||
Start Learning
|
||||
</span>
|
||||
) : (
|
||||
<span className="relative flex items-center gap-2">
|
||||
Buy Now ${coursePricing?.regionalPrice}
|
||||
<ArrowRightIcon className="h-5 w-5 transition-transform duration-300 ease-out group-hover:translate-x-1" />
|
||||
</span>
|
||||
)}
|
||||
</button>
|
||||
|
||||
{!isLoadingPricing && !isAlreadyEnrolled && (
|
||||
<span className="top-full text-sm text-yellow-400">
|
||||
Lifetime access <span className="mx-1">·</span> Free updates
|
||||
</span>
|
||||
)}
|
||||
</div>
|
||||
);
|
||||
}
|
||||
@@ -1,145 +0,0 @@
|
||||
import { ChevronDown, BookIcon, CodeIcon, FileQuestion, MessageCircleQuestionIcon, CircleDot } from 'lucide-react';
|
||||
import { cn } from '../../lib/classname';
|
||||
import { useEffect, useState } from 'react';
|
||||
|
||||
type ChapterRowProps = {
|
||||
counter: number;
|
||||
icon: React.ReactNode;
|
||||
title: string;
|
||||
description: string;
|
||||
lessonCount: number;
|
||||
challengeCount: number;
|
||||
isExpandable?: boolean;
|
||||
className?: string;
|
||||
lessons?: { title: string; type: 'lesson' | 'challenge' | 'quiz' }[];
|
||||
};
|
||||
|
||||
export function ChapterRow(props: ChapterRowProps) {
|
||||
const {
|
||||
counter,
|
||||
icon,
|
||||
title,
|
||||
description,
|
||||
lessonCount,
|
||||
challengeCount,
|
||||
isExpandable = true,
|
||||
className,
|
||||
lessons = [],
|
||||
} = props;
|
||||
|
||||
const [isExpanded, setIsExpanded] = useState(true);
|
||||
|
||||
const regularLessons = lessons.filter((l) => l.type === 'lesson');
|
||||
const challenges = lessons.filter((l) =>
|
||||
['challenge', 'quiz'].includes(l.type),
|
||||
);
|
||||
|
||||
useEffect(() => {
|
||||
const isMobile = window.innerWidth < 768;
|
||||
setIsExpanded(!isMobile);
|
||||
}, []);
|
||||
|
||||
return (
|
||||
<div
|
||||
className={cn('group relative select-none overflow-hidden', className)}
|
||||
>
|
||||
<div
|
||||
role="button"
|
||||
onClick={() => isExpandable && setIsExpanded(!isExpanded)}
|
||||
className={cn(
|
||||
'relative rounded-xl border border-zinc-800 bg-zinc-800 p-6',
|
||||
'bg-gradient-to-br from-zinc-900/90 via-zinc-900/70 to-zinc-900/50',
|
||||
!isExpanded &&
|
||||
'hover:bg-gradient-to-br hover:from-zinc-900/95 hover:via-zinc-900/80 hover:to-zinc-900/60',
|
||||
!isExpanded &&
|
||||
'hover:cursor-pointer hover:shadow-[0_0_30px_rgba(0,0,0,0.2)]',
|
||||
isExpanded && 'rounded-b-none border-b-0',
|
||||
)}
|
||||
>
|
||||
<div className="flex items-start gap-4">
|
||||
<div className="hidden flex-shrink-0 md:block">
|
||||
<div className="rounded-full bg-yellow-500/10 p-3">{icon}</div>
|
||||
</div>
|
||||
|
||||
<div className="flex-grow">
|
||||
<h3 className="text-xl font-semibold tracking-wide text-white">
|
||||
<span className="inline text-gray-500 md:hidden">
|
||||
{counter}.{' '}
|
||||
</span>
|
||||
{title}
|
||||
</h3>
|
||||
<p className="mt-2 text-zinc-400">{description}</p>
|
||||
|
||||
<div className="mt-4 flex items-center gap-4">
|
||||
<div className="flex items-center gap-2 text-sm text-zinc-500">
|
||||
<span>{lessonCount} Lessons</span>
|
||||
</div>
|
||||
<div className="flex items-center gap-2 text-sm text-zinc-500">
|
||||
<span>{challengeCount} Challenges</span>
|
||||
</div>
|
||||
</div>
|
||||
</div>
|
||||
|
||||
{isExpandable && (
|
||||
<div className="flex-shrink-0 rounded-full bg-zinc-800/80 p-2 text-zinc-400 group-hover:bg-zinc-800 group-hover:text-yellow-500">
|
||||
<ChevronDown
|
||||
className={cn(
|
||||
'h-4 w-4 transition-transform',
|
||||
isExpanded ? 'rotate-180' : '',
|
||||
)}
|
||||
/>
|
||||
</div>
|
||||
)}
|
||||
</div>
|
||||
</div>
|
||||
|
||||
{isExpanded && (
|
||||
<div className="rounded-b-xl border border-t-0 border-zinc-800 bg-gradient-to-br from-zinc-900/50 via-zinc-900/30 to-zinc-900/20">
|
||||
<div className="grid grid-cols-1 divide-zinc-800 md:grid-cols-2 md:divide-x">
|
||||
{regularLessons.length > 0 && (
|
||||
<div className="p-6 pb-0 md:pb-6">
|
||||
<h4 className="mb-4 text-sm font-medium uppercase tracking-wider text-zinc-500">
|
||||
Lessons
|
||||
</h4>
|
||||
<div className="space-y-3">
|
||||
{regularLessons.map((lesson, index) => (
|
||||
<div
|
||||
key={index}
|
||||
className="flex items-center gap-3 text-zinc-400 hover:text-yellow-500"
|
||||
>
|
||||
<BookIcon className="h-4 w-4" />
|
||||
<span>{lesson.title}</span>
|
||||
</div>
|
||||
))}
|
||||
</div>
|
||||
</div>
|
||||
)}
|
||||
|
||||
{challenges.length > 0 && (
|
||||
<div className="p-6">
|
||||
<h4 className="mb-4 text-sm font-medium uppercase tracking-wider text-zinc-500">
|
||||
Exercises
|
||||
</h4>
|
||||
<div className="space-y-3">
|
||||
{challenges.map((challenge, index) => (
|
||||
<div
|
||||
key={index}
|
||||
className="flex items-center gap-3 text-zinc-400 hover:text-yellow-500"
|
||||
>
|
||||
{challenge.type === 'challenge' ? (
|
||||
<CodeIcon className="h-4 w-4" />
|
||||
) : (
|
||||
<CircleDot className="h-4 w-4" />
|
||||
)}
|
||||
<span>{challenge.title}</span>
|
||||
</div>
|
||||
))}
|
||||
</div>
|
||||
</div>
|
||||
)}
|
||||
</div>
|
||||
</div>
|
||||
)}
|
||||
</div>
|
||||
);
|
||||
}
|
||||
@@ -1,43 +0,0 @@
|
||||
import { Database, X } from 'lucide-react';
|
||||
import { useEffect, useState } from 'react';
|
||||
|
||||
export function CourseAnnouncement() {
|
||||
const [isVisible, setIsVisible] = useState(true);
|
||||
|
||||
if (!isVisible) {
|
||||
return null;
|
||||
}
|
||||
|
||||
return (
|
||||
<div className="sticky top-0 z-[91]">
|
||||
<a
|
||||
href="/courses/sql"
|
||||
className="flex items-center bg-yellow-400 py-1.5"
|
||||
>
|
||||
<span className="container mx-auto flex items-center justify-start sm:justify-center gap-2 text-center sm:gap-4">
|
||||
<span className="flex items-center gap-1.5 text-xs font-medium text-black md:text-base">
|
||||
<Database className="hidden h-4 w-4 flex-shrink-0 text-black sm:block" />
|
||||
<span className="hidden sm:block">
|
||||
Master SQL with our new paid course
|
||||
</span>
|
||||
<span className="block sm:hidden">Announcing our SQL course</span>
|
||||
</span>
|
||||
<span className="items-center gap-1.5 rounded-full bg-black px-2 py-0.5 text-sm text-xs font-medium uppercase tracking-wide text-white hover:bg-zinc-800 sm:px-3 sm:py-1">
|
||||
<span className="mr-1.5 hidden sm:inline">Start Learning</span>
|
||||
<span className="mr-1.5 inline sm:hidden">Visit</span>
|
||||
<span className="">→</span>
|
||||
</span>
|
||||
</span>
|
||||
</a>
|
||||
<button
|
||||
type="button"
|
||||
className="absolute right-3.5 top-1/2 -translate-y-1/2 rounded-lg px-1.5 py-1.5 text-gray-500 hover:bg-yellow-500 hover:text-gray-700"
|
||||
onClick={(e) => {
|
||||
setIsVisible(false);
|
||||
}}
|
||||
>
|
||||
<X className="h-4 w-4" />
|
||||
</button>
|
||||
</div>
|
||||
);
|
||||
}
|
||||
@@ -1,25 +0,0 @@
|
||||
export function CourseAuthor() {
|
||||
return (
|
||||
<div className="mt-8 w-full max-w-3xl space-y-4">
|
||||
<div className="flex flex-row items-center gap-5">
|
||||
<img
|
||||
src="https://assets.roadmap.sh/guest/kamran-lqjta.jpeg"
|
||||
className="size-12 rounded-full bg-yellow-500/10 md:size-16"
|
||||
alt="Kamran Ahmed"
|
||||
/>
|
||||
<a
|
||||
href="https://twitter.com/kamrify"
|
||||
target="_blank"
|
||||
className="flex flex-col"
|
||||
>
|
||||
<span className="text-lg font-medium text-zinc-200 md:text-2xl">
|
||||
Kamran Ahmed
|
||||
</span>
|
||||
<span className="text-sm text-zinc-500 md:text-lg">
|
||||
Software Engineer
|
||||
</span>
|
||||
</a>
|
||||
</div>
|
||||
</div>
|
||||
);
|
||||
}
|
||||
@@ -1,94 +0,0 @@
|
||||
import { MinusIcon, PlusIcon, type LucideIcon } from 'lucide-react';
|
||||
import { useEffect, useState } from 'react';
|
||||
import { cn } from '../../lib/classname';
|
||||
|
||||
type CourseFeatureProps = {
|
||||
title: string;
|
||||
icon: LucideIcon;
|
||||
description: string;
|
||||
imgUrl?: string;
|
||||
};
|
||||
|
||||
export function CourseFeature(props: CourseFeatureProps) {
|
||||
const { title, icon: Icon, description, imgUrl } = props;
|
||||
|
||||
const [isExpanded, setIsExpanded] = useState(false);
|
||||
const [isZoomed, setIsZoomed] = useState(false);
|
||||
|
||||
useEffect(() => {
|
||||
function onScroll() {
|
||||
if (isZoomed) {
|
||||
setIsZoomed(false);
|
||||
}
|
||||
}
|
||||
|
||||
window.addEventListener('scroll', onScroll);
|
||||
return () => window.removeEventListener('scroll', onScroll);
|
||||
}, [isZoomed]);
|
||||
|
||||
return (
|
||||
<>
|
||||
{isZoomed && (
|
||||
<div
|
||||
onClick={() => {
|
||||
setIsZoomed(false);
|
||||
setIsExpanded(false);
|
||||
}}
|
||||
className="fixed inset-0 z-[999] flex cursor-zoom-out items-center justify-center bg-black bg-opacity-75"
|
||||
>
|
||||
<img
|
||||
src={imgUrl}
|
||||
alt={title}
|
||||
className="max-h-[50%] max-w-[90%] rounded-xl object-contain"
|
||||
/>
|
||||
</div>
|
||||
)}
|
||||
<div
|
||||
className={cn(
|
||||
'fixed inset-0 z-10 bg-black/70 opacity-100 transition-opacity duration-200 ease-out',
|
||||
{
|
||||
'pointer-events-none opacity-0': !isExpanded,
|
||||
},
|
||||
)}
|
||||
onClick={() => setIsExpanded(false)}
|
||||
></div>
|
||||
<div className="relative">
|
||||
<button
|
||||
onClick={() => setIsExpanded(!isExpanded)}
|
||||
className={cn(
|
||||
'z-20 flex w-full items-center rounded-lg border border-zinc-800 bg-zinc-900/50 px-4 py-3 text-left transition-colors duration-200 ease-out hover:bg-zinc-800/40',
|
||||
{
|
||||
'relative bg-zinc-800 hover:bg-zinc-800': isExpanded,
|
||||
},
|
||||
)}
|
||||
>
|
||||
<span className="flex flex-grow items-center space-x-3">
|
||||
<Icon />
|
||||
<span>{title}</span>
|
||||
</span>
|
||||
{isExpanded ? (
|
||||
<MinusIcon className="h-4 w-4" />
|
||||
) : (
|
||||
<PlusIcon className="h-4 w-4" />
|
||||
)}
|
||||
</button>
|
||||
{isExpanded && (
|
||||
<div className="absolute left-0 top-full z-20 translate-y-2 rounded-lg border border-zinc-800 bg-zinc-800 p-4">
|
||||
<p>{description}</p>
|
||||
{imgUrl && (
|
||||
<img
|
||||
onClick={() => {
|
||||
setIsZoomed(true);
|
||||
setIsExpanded(false);
|
||||
}}
|
||||
src={imgUrl}
|
||||
alt={title}
|
||||
className="mt-4 h-auto pointer-events-none md:pointer-events-auto w-full cursor-zoom-in rounded-lg object-right-top"
|
||||
/>
|
||||
)}
|
||||
</div>
|
||||
)}
|
||||
</div>
|
||||
</>
|
||||
);
|
||||
}
|
||||
@@ -1,113 +0,0 @@
|
||||
import { ChevronDownIcon } from 'lucide-react';
|
||||
import { useState } from 'react';
|
||||
import { SectionHeader } from './SectionHeader';
|
||||
|
||||
type FAQItem = {
|
||||
question: string;
|
||||
answer: string;
|
||||
};
|
||||
|
||||
function FAQRow({ question, answer }: FAQItem) {
|
||||
const [isExpanded, setIsExpanded] = useState(false);
|
||||
|
||||
return (
|
||||
<div className="rounded-lg border border-zinc-800 bg-zinc-900">
|
||||
<button
|
||||
onClick={() => setIsExpanded(!isExpanded)}
|
||||
className="flex w-full items-center justify-between p-4 md:p-6 text-left gap-2"
|
||||
>
|
||||
<h3 className="text-lg md:text-xl text-balance font-normal text-white">{question}</h3>
|
||||
<ChevronDownIcon
|
||||
className={`h-5 w-5 text-zinc-400 transition-transform duration-200 ${
|
||||
isExpanded ? 'rotate-180' : ''
|
||||
}`}
|
||||
/>
|
||||
</button>
|
||||
{isExpanded && (
|
||||
<div className="border-t border-zinc-800 p-6 pt-4 text-base md:text-lg leading-relaxed">
|
||||
<p>{answer}</p>
|
||||
</div>
|
||||
)}
|
||||
</div>
|
||||
);
|
||||
}
|
||||
|
||||
export function FAQSection() {
|
||||
const faqs: FAQItem[] = [
|
||||
{
|
||||
question: 'What is the format of the course?',
|
||||
answer:
|
||||
'The course is written in textual format. There are several chapters; each chapter has a set of lessons, followed by a set of practice problems and quizzes. You can learn at your own pace and revisit the content anytime.',
|
||||
},
|
||||
{
|
||||
question: 'What prerequisites do I need for this course?',
|
||||
answer:
|
||||
'No prior SQL knowledge is required. The course starts from the basics and gradually progresses to advanced topics.',
|
||||
},
|
||||
{
|
||||
question: 'Do I need to have a local database to follow the course?',
|
||||
answer:
|
||||
'No, we have an integrated coding playground, populated with a sample databases depending on the lesson, that you can use to follow the course. You can also use your own database if you have one.',
|
||||
},
|
||||
{
|
||||
question: 'How long do I have access to the course?',
|
||||
answer:
|
||||
'You get lifetime access to the course including all future updates. Once you purchase, you can learn at your own pace and revisit the content anytime.',
|
||||
},
|
||||
{
|
||||
question: 'What kind of support is available?',
|
||||
answer:
|
||||
'You get access to an AI tutor within the course that can help you with queries 24/7. Additionally, you can use the community forums to discuss problems and get help from other learners.',
|
||||
},
|
||||
{
|
||||
question: 'Will I get a certificate upon completion?',
|
||||
answer:
|
||||
"Yes, upon completing the course and its challenges, you'll receive a certificate of completion that you can share with employers or add to your LinkedIn profile.",
|
||||
},
|
||||
{
|
||||
question: 'Can I use this for job interviews?',
|
||||
answer:
|
||||
'Absolutely! The course covers common SQL interview topics and includes practical challenges similar to what you might face in technical interviews. The hands-on experience will prepare you well for real-world scenarios.',
|
||||
},
|
||||
{
|
||||
question: "What if I don't like the course?",
|
||||
answer:
|
||||
'I will refund your purchase within 7 days of the purchase. No questions asked. However, I would love to hear your feedback so that I can improve the course. Send me an email at kamran@roadmap.sh',
|
||||
},
|
||||
{
|
||||
question: 'I already know SQL, can I still take this course?',
|
||||
answer:
|
||||
'Yes! The course starts from the basics and gradually progresses to advanced topics. You can skip the chapters that you already know and focus on the ones that you need.',
|
||||
},
|
||||
{
|
||||
question: 'Do you offer any team licenses?',
|
||||
answer: 'Yes, please contact me at kamran@roadmap.sh',
|
||||
},
|
||||
{
|
||||
question: 'How can I gift this course to someone?',
|
||||
answer:
|
||||
'Please contact me at kamran@roadmap.sh and I will be happy to help you.',
|
||||
},
|
||||
{
|
||||
question: 'What if I have a question that is not answered here?',
|
||||
answer:
|
||||
'Please contact me at kamran@roadmap.sh and I will be happy to help you.',
|
||||
},
|
||||
];
|
||||
|
||||
return (
|
||||
<>
|
||||
<SectionHeader
|
||||
title="Frequently Asked Questions"
|
||||
description="Find answers to common questions about the course below."
|
||||
className="mt-10 md:mt-24"
|
||||
/>
|
||||
|
||||
<div className="mt-6 md:mt-8 w-full max-w-3xl space-y-2 md:space-y-6">
|
||||
{faqs.map((faq, index) => (
|
||||
<FAQRow key={index} {...faq} />
|
||||
))}
|
||||
</div>
|
||||
</>
|
||||
);
|
||||
}
|
||||
@@ -1,56 +0,0 @@
|
||||
import { ArrowRightIcon } from 'lucide-react';
|
||||
import { useEffect, useState } from 'react';
|
||||
import { cn } from '../../lib/classname';
|
||||
import { BuyButton } from './BuyButton';
|
||||
|
||||
export function FloatingPurchase() {
|
||||
const [isHidden, setIsHidden] = useState(true);
|
||||
|
||||
useEffect(() => {
|
||||
function onScroll() {
|
||||
setIsHidden(window.scrollY < 400);
|
||||
}
|
||||
|
||||
window.addEventListener('scroll', onScroll);
|
||||
return () => window.removeEventListener('scroll', onScroll);
|
||||
}, []);
|
||||
|
||||
return (
|
||||
<div
|
||||
className={cn(
|
||||
'fixed bottom-0 left-0 right-0 z-[5] flex items-center justify-center transition-all duration-200 ease-out',
|
||||
{
|
||||
'pointer-events-none -bottom-10 opacity-0': isHidden,
|
||||
},
|
||||
)}
|
||||
>
|
||||
{/* Desktop version */}
|
||||
<div className="hidden mb-5 md:flex w-full max-w-[800px] items-center justify-between rounded-2xl bg-yellow-950 p-5 shadow-lg ring-1 ring-yellow-500/40">
|
||||
<div className="flex flex-col">
|
||||
<h2 className="mb-1 text-xl font-medium text-white">
|
||||
Go from Zero to Hero in SQL
|
||||
</h2>
|
||||
<p className="text-sm text-zinc-400">
|
||||
Get instant access to the course and start learning today
|
||||
</p>
|
||||
</div>
|
||||
|
||||
<BuyButton variant="floating" />
|
||||
</div>
|
||||
|
||||
{/* Mobile version */}
|
||||
<div className="flex md:hidden w-full flex-col bg-yellow-950 px-4 pt-3 pb-4 shadow-lg ring-1 ring-yellow-500/40">
|
||||
<div className="flex flex-col items-center text-center mb-3">
|
||||
<h2 className="text-lg font-medium text-white">
|
||||
Master SQL Today
|
||||
</h2>
|
||||
<p className="text-xs text-zinc-400">
|
||||
Get instant lifetime access
|
||||
</p>
|
||||
</div>
|
||||
|
||||
<BuyButton variant="floating" />
|
||||
</div>
|
||||
</div>
|
||||
);
|
||||
}
|
||||
@@ -1,40 +0,0 @@
|
||||
import { SectionHeader } from './SectionHeader';
|
||||
import { useEffect, useState } from 'react';
|
||||
|
||||
export function PlatformDemo() {
|
||||
const [isZoomed, setIsZoomed] = useState(false);
|
||||
|
||||
useEffect(() => {
|
||||
function onScroll() {
|
||||
if (isZoomed) {
|
||||
setIsZoomed(false);
|
||||
}
|
||||
}
|
||||
|
||||
window.addEventListener('scroll', onScroll);
|
||||
return () => window.removeEventListener('scroll', onScroll);
|
||||
}, [isZoomed]);
|
||||
|
||||
return (
|
||||
<>
|
||||
{isZoomed && (
|
||||
<div
|
||||
onClick={() => setIsZoomed(false)}
|
||||
className="fixed inset-0 z-[999] flex cursor-zoom-out items-center justify-center bg-black bg-opacity-75"
|
||||
>
|
||||
<img
|
||||
src="https://assets.roadmap.sh/guest/course-environment-87jg8.png"
|
||||
alt="Course Environment"
|
||||
className="max-h-[90vh] max-w-[90vw] rounded-xl object-contain"
|
||||
/>
|
||||
</div>
|
||||
)}
|
||||
<img
|
||||
src="https://assets.roadmap.sh/guest/course-environment-87jg8.png"
|
||||
alt="Course Environment"
|
||||
onClick={() => setIsZoomed(true)}
|
||||
className="mt-12 sm:mt-20 w-full max-w-5xl rounded-xl cursor-zoom-in"
|
||||
/>
|
||||
</>
|
||||
);
|
||||
}
|
||||
@@ -1,420 +0,0 @@
|
||||
import {
|
||||
ArrowRightIcon,
|
||||
ArrowUpDownIcon,
|
||||
BarChartIcon,
|
||||
BrainIcon,
|
||||
ClipboardIcon,
|
||||
CodeIcon,
|
||||
DatabaseIcon,
|
||||
Eye,
|
||||
FileCheckIcon,
|
||||
FileQuestionIcon,
|
||||
GitBranchIcon,
|
||||
GitMergeIcon,
|
||||
LayersIcon,
|
||||
TableIcon,
|
||||
WrenchIcon,
|
||||
} from 'lucide-react';
|
||||
import { ChapterRow } from './ChapterRow';
|
||||
import { CourseFeature } from './CourseFeature';
|
||||
import { SectionHeader } from './SectionHeader';
|
||||
import { Spotlight } from './Spotlight';
|
||||
import { FloatingPurchase } from './FloatingPurchase';
|
||||
import { CourseAuthor } from './CourseAuthor';
|
||||
import { FAQSection } from './FAQSection';
|
||||
import { BuyButton } from './BuyButton';
|
||||
import { AccountButton } from './AccountButton';
|
||||
import { RoadmapLogoIcon } from '../ReactIcons/RoadmapLogo';
|
||||
import { PlatformDemo } from './PlatformDemo';
|
||||
import { AuthorQuoteMessage } from './AuthorQuoteMessage';
|
||||
type ChapterData = {
|
||||
icon: React.ReactNode;
|
||||
title: string;
|
||||
description: string;
|
||||
lessonCount: number;
|
||||
challengeCount: number;
|
||||
lessons: { title: string; type: 'lesson' | 'challenge' | 'quiz' }[];
|
||||
};
|
||||
|
||||
export function SQLCoursePage() {
|
||||
const chapters: ChapterData[] = [
|
||||
{
|
||||
icon: <DatabaseIcon className="h-6 w-6 text-yellow-500" />,
|
||||
title: 'Introduction',
|
||||
description:
|
||||
'Get comfortable with database concepts and SQL fundamentals.',
|
||||
lessonCount: 4,
|
||||
challengeCount: 1,
|
||||
lessons: [
|
||||
{ title: 'Basics of Databases', type: 'lesson' },
|
||||
{ title: 'What is SQL?', type: 'lesson' },
|
||||
{ title: 'Types of Queries', type: 'lesson' },
|
||||
{ title: 'Next Steps', type: 'lesson' },
|
||||
{ title: 'Introduction Quiz', type: 'challenge' },
|
||||
],
|
||||
},
|
||||
{
|
||||
icon: <TableIcon className="h-6 w-6 text-yellow-500" />,
|
||||
title: 'SQL Basics',
|
||||
description: 'Master the essential SQL query operations and syntax.',
|
||||
lessonCount: 9,
|
||||
challengeCount: 7,
|
||||
lessons: [
|
||||
{ title: 'SELECT Fundamentals', type: 'lesson' },
|
||||
{ title: 'Aliases and Constants', type: 'lesson' },
|
||||
{ title: 'Expressions in SELECT', type: 'lesson' },
|
||||
{ title: 'Selecting DISTINCT Values', type: 'lesson' },
|
||||
{ title: 'Filtering with WHERE', type: 'lesson' },
|
||||
{ title: 'Sorting with ORDER BY', type: 'lesson' },
|
||||
{ title: 'Limiting Results with LIMIT', type: 'lesson' },
|
||||
{ title: 'Handling NULL Values', type: 'lesson' },
|
||||
{ title: 'Comments', type: 'lesson' },
|
||||
{ title: 'Basic Queries Quiz', type: 'quiz' },
|
||||
{ title: 'Projection Challenge', type: 'challenge' },
|
||||
{ title: 'Select Expression', type: 'challenge' },
|
||||
{ title: 'Select Unique', type: 'challenge' },
|
||||
{ title: 'Logical Operators', type: 'challenge' },
|
||||
{ title: 'Sorting Challenge', type: 'challenge' },
|
||||
{ title: 'Sorting and Limiting', type: 'challenge' },
|
||||
{ title: 'Sorting and Filtering', type: 'challenge' },
|
||||
],
|
||||
},
|
||||
{
|
||||
icon: <CodeIcon className="h-6 w-6 text-yellow-500" />,
|
||||
title: 'Manipulating Data',
|
||||
description: 'Learn how to modify and manipulate data in your database.',
|
||||
lessonCount: 3,
|
||||
challengeCount: 3,
|
||||
lessons: [
|
||||
{ title: 'INSERT Operations', type: 'lesson' },
|
||||
{ title: 'UPDATE Operations', type: 'lesson' },
|
||||
{ title: 'DELETE Operations', type: 'lesson' },
|
||||
{ title: 'Data Manipulation Quiz', type: 'quiz' },
|
||||
{ title: 'Inserting Customers', type: 'challenge' },
|
||||
{ title: 'Updating Bookstore', type: 'challenge' },
|
||||
{ title: 'Deleting Books', type: 'challenge' },
|
||||
],
|
||||
},
|
||||
{
|
||||
icon: <LayersIcon className="h-6 w-6 text-yellow-500" />,
|
||||
title: 'Defining Tables',
|
||||
description: 'Master database schema design and table management.',
|
||||
lessonCount: 9,
|
||||
challengeCount: 7,
|
||||
lessons: [
|
||||
{ title: 'Creating Tables', type: 'lesson' },
|
||||
{ title: 'Data Types in SQLite', type: 'lesson' },
|
||||
{ title: 'Common Data Types', type: 'lesson' },
|
||||
{ title: 'More on Numeric Types', type: 'lesson' },
|
||||
{ title: 'Temporal Data Types', type: 'lesson' },
|
||||
{ title: 'CHECK Constraints', type: 'lesson' },
|
||||
{ title: 'Primary Key Constraint', type: 'lesson' },
|
||||
{ title: 'Modifying Tables', type: 'lesson' },
|
||||
{ title: 'Dropping and Truncating', type: 'lesson' },
|
||||
{ title: 'Defining Tables Quiz', type: 'quiz' },
|
||||
{ title: 'Simple Table Creation', type: 'challenge' },
|
||||
{ title: 'Data Types Challenge', type: 'challenge' },
|
||||
{ title: 'Constraints Challenge', type: 'challenge' },
|
||||
{ title: 'Temporal Validation', type: 'challenge' },
|
||||
{ title: 'Sales Data Analysis', type: 'challenge' },
|
||||
{ title: 'Modifying Tables', type: 'challenge' },
|
||||
{ title: 'Removing Table Data', type: 'challenge' },
|
||||
],
|
||||
},
|
||||
{
|
||||
icon: <GitMergeIcon className="h-6 w-6 text-yellow-500" />,
|
||||
title: 'Multi-Table Queries',
|
||||
description:
|
||||
'Learn to work with multiple tables using JOINs and relationships.',
|
||||
lessonCount: 7,
|
||||
challengeCount: 10,
|
||||
lessons: [
|
||||
{ title: 'More on Relational Data', type: 'lesson' },
|
||||
{ title: 'Relationships and Types', type: 'lesson' },
|
||||
{ title: 'JOINs in Queries', type: 'lesson' },
|
||||
{ title: 'Self Joins and Usecases', type: 'lesson' },
|
||||
{ title: 'Foreign Key Constraint', type: 'lesson' },
|
||||
{ title: 'Set Operator Queries', type: 'lesson' },
|
||||
{ title: 'Views and Virtual Tables', type: 'lesson' },
|
||||
{ title: 'Multi-Table Queries Quiz', type: 'quiz' },
|
||||
{ title: 'Inactive Customers', type: 'challenge' },
|
||||
{ title: 'Recent 3 Orders', type: 'challenge' },
|
||||
{ title: 'High Value Orders', type: 'challenge' },
|
||||
{ title: 'Specific Book Customers', type: 'challenge' },
|
||||
{ title: 'Referred Customers', type: 'challenge' },
|
||||
{ title: 'Readers Like You', type: 'challenge' },
|
||||
{ title: 'Same Price Books', type: 'challenge' },
|
||||
{ title: 'Multi-Section Authors', type: 'challenge' },
|
||||
{ title: 'Expensive Books', type: 'challenge' },
|
||||
{ title: 'Trending Tech Books', type: 'challenge' },
|
||||
],
|
||||
},
|
||||
{
|
||||
icon: <WrenchIcon className="h-6 w-6 text-yellow-500" />,
|
||||
title: 'Aggregate Functions',
|
||||
description:
|
||||
"Analyze and summarize data using SQL's powerful aggregation features.",
|
||||
lessonCount: 4,
|
||||
challengeCount: 10,
|
||||
lessons: [
|
||||
{ title: 'What is Aggregation?', type: 'lesson' },
|
||||
{ title: 'Basic Aggregation', type: 'lesson' },
|
||||
{ title: 'Grouping Data', type: 'lesson' },
|
||||
{ title: 'Grouping and Filtering', type: 'lesson' },
|
||||
{ title: 'Aggregate Queries Quiz', type: 'quiz' },
|
||||
{ title: 'Book Sales Summary', type: 'challenge' },
|
||||
{ title: 'Category Insights', type: 'challenge' },
|
||||
{ title: 'Author Tier Analysis', type: 'challenge' },
|
||||
{ title: 'Author Book Stats', type: 'challenge' },
|
||||
{ title: 'Daily Sales Report', type: 'challenge' },
|
||||
{ title: 'Publisher Stats', type: 'challenge' },
|
||||
{ title: 'High Value Publishers', type: 'challenge' },
|
||||
{ title: 'Premium Authors', type: 'challenge' },
|
||||
{ title: 'Sales Analysis', type: 'challenge' },
|
||||
{ title: 'Employee Performance', type: 'challenge' },
|
||||
],
|
||||
},
|
||||
{
|
||||
icon: <BarChartIcon className="h-6 w-6 text-yellow-500" />,
|
||||
title: 'Scalar Functions',
|
||||
description:
|
||||
'Master built-in functions for data transformation and manipulation.',
|
||||
lessonCount: 6,
|
||||
challengeCount: 5,
|
||||
lessons: [
|
||||
{ title: 'What are they?', type: 'lesson' },
|
||||
{ title: 'String Functions', type: 'lesson' },
|
||||
{ title: 'Numeric Functions', type: 'lesson' },
|
||||
{ title: 'Date Functions', type: 'lesson' },
|
||||
{ title: 'Conversion Functions', type: 'lesson' },
|
||||
{ title: 'Logical Functions', type: 'lesson' },
|
||||
{ title: 'Scalar Functions Quiz', type: 'quiz' },
|
||||
{ title: 'Customer Contact List', type: 'challenge' },
|
||||
{ title: 'Membership Duration', type: 'challenge' },
|
||||
{ title: 'Book Performance', type: 'challenge' },
|
||||
{ title: 'Book Categories', type: 'challenge' },
|
||||
{ title: 'Monthly Sales Analysis', type: 'challenge' },
|
||||
],
|
||||
},
|
||||
{
|
||||
icon: <GitBranchIcon className="h-6 w-6 text-yellow-500" />,
|
||||
title: 'Subqueries and CTEs',
|
||||
description:
|
||||
'Write complex queries using subqueries and common table expressions.',
|
||||
lessonCount: 4,
|
||||
challengeCount: 6,
|
||||
lessons: [
|
||||
{ title: 'What are Subqueries?', type: 'lesson' },
|
||||
{ title: 'Correlated Subqueries', type: 'lesson' },
|
||||
{ title: 'Common Table Expressions', type: 'lesson' },
|
||||
{ title: 'Recursive CTEs', type: 'lesson' },
|
||||
{ title: 'Subqueries Quiz', type: 'quiz' },
|
||||
{ title: 'Books Above Average', type: 'challenge' },
|
||||
{ title: 'Latest Category Books', type: 'challenge' },
|
||||
{ title: 'Low Stock by Category', type: 'challenge' },
|
||||
{ title: 'Bestseller Rankings', type: 'challenge' },
|
||||
{ title: 'New Customer Analysis', type: 'challenge' },
|
||||
{ title: 'Daily Sales Report', type: 'challenge' },
|
||||
],
|
||||
},
|
||||
{
|
||||
icon: <ArrowUpDownIcon className="h-6 w-6 text-yellow-500" />,
|
||||
title: 'Window Functions',
|
||||
description:
|
||||
'Advanced analytics and calculations using window functions.',
|
||||
lessonCount: 5,
|
||||
challengeCount: 7,
|
||||
lessons: [
|
||||
{ title: 'What are they?', type: 'lesson' },
|
||||
{ title: 'OVER and PARTITION BY', type: 'lesson' },
|
||||
{ title: 'Use of ORDER BY', type: 'lesson' },
|
||||
{ title: 'Ranking Functions', type: 'lesson' },
|
||||
{ title: 'Window Frames', type: 'lesson' },
|
||||
{ title: 'Window Functions Quiz', type: 'quiz' },
|
||||
{ title: 'Basic Sales Metrics', type: 'challenge' },
|
||||
{ title: 'Bestseller Comparison', type: 'challenge' },
|
||||
{ title: 'Author Category Sales', type: 'challenge' },
|
||||
{ title: 'Top Authors', type: 'challenge' },
|
||||
{ title: 'Price Tier Rankings', type: 'challenge' },
|
||||
{ title: 'Month-over-Month Sales', type: 'challenge' },
|
||||
{ title: 'Price Range Analysis', type: 'challenge' },
|
||||
],
|
||||
},
|
||||
];
|
||||
|
||||
return (
|
||||
<div className="relative flex flex-grow flex-col items-center bg-gradient-to-b from-zinc-900 to-zinc-950 px-4 pb-52 pt-3 text-zinc-400 md:px-10 md:pt-8">
|
||||
<div className="flex w-full items-center justify-between">
|
||||
<a
|
||||
href="https://roadmap.sh"
|
||||
target="_blank"
|
||||
className="opacity-20 transition-opacity hover:opacity-100"
|
||||
>
|
||||
<RoadmapLogoIcon />
|
||||
</a>
|
||||
<AccountButton />
|
||||
</div>
|
||||
<div className="relative mt-7 max-w-3xl text-left md:mt-20 md:text-center">
|
||||
<Spotlight className="left-[-170px] top-[-200px]" fill="#EAB308" />
|
||||
<div className="inline-block rounded-full bg-yellow-500/10 px-4 py-1.5 text-base text-yellow-500 md:px-6 md:py-2 md:text-lg">
|
||||
<span className="hidden sm:block">
|
||||
Complete Course to Master Practical SQL
|
||||
</span>
|
||||
<span className="block sm:hidden">Complete SQL Course</span>
|
||||
</div>
|
||||
|
||||
<h1 className="mt-5 text-4xl font-bold tracking-tight text-white md:mt-8 md:text-7xl">
|
||||
Master SQL <span className="hidden min-[384px]:inline">Queries</span>
|
||||
<div className="mt-2.5 bg-gradient-to-r from-yellow-500 to-yellow-300 bg-clip-text text-transparent md:text-6xl lg:text-7xl">
|
||||
From Basic to Advanced
|
||||
</div>
|
||||
</h1>
|
||||
|
||||
<p className="mx-auto my-5 max-w-2xl text-xl text-zinc-300 md:my-12 lg:text-2xl">
|
||||
A structured course to master database querying - perfect for
|
||||
developers, data analysts, and anyone working with data.
|
||||
</p>
|
||||
|
||||
<div className="hidden flex-row items-center justify-center gap-5 md:flex">
|
||||
<div className="flex flex-row items-center gap-2">
|
||||
<ClipboardIcon className="size-6 text-yellow-600" />
|
||||
<span>55+ Lessons</span>
|
||||
</div>
|
||||
<div className="flex flex-row items-center gap-2">
|
||||
<FileQuestionIcon className="size-6 text-yellow-600" />
|
||||
<span>100+ Challenges</span>
|
||||
</div>
|
||||
<div className="flex flex-row items-center gap-2">
|
||||
<CodeIcon className="size-6 text-yellow-600" />
|
||||
<span>Integrated IDE</span>
|
||||
</div>
|
||||
<div className="flex flex-row items-center gap-2">
|
||||
<BrainIcon className="size-6 text-yellow-600" />
|
||||
<span>AI Tutor</span>
|
||||
</div>
|
||||
</div>
|
||||
|
||||
<div className="mt-7 flex justify-start md:mt-12 md:justify-center">
|
||||
<BuyButton variant="main" />
|
||||
</div>
|
||||
</div>
|
||||
|
||||
<AuthorQuoteMessage />
|
||||
|
||||
<PlatformDemo />
|
||||
|
||||
<SectionHeader
|
||||
title="Not your average SQL course"
|
||||
description="Built around a text-based interactive approach and packed with practical challenges, this course stands out with features that make it truly unique."
|
||||
className="mt-16 md:mt-32"
|
||||
/>
|
||||
|
||||
<div className="mx-auto mt-6 w-full max-w-5xl md:mt-10">
|
||||
<div className="grid grid-cols-1 gap-2 md:grid-cols-2 md:gap-4 lg:grid-cols-3">
|
||||
<CourseFeature
|
||||
title="Textual Course"
|
||||
icon={Eye}
|
||||
imgUrl="https://assets.roadmap.sh/guest/textual-course.png"
|
||||
description="Unlike video-based courses where you have to learn at the pace of the instructor, this course is text-based, allowing you to learn at your own pace."
|
||||
/>
|
||||
<CourseFeature
|
||||
title="Coding Environment"
|
||||
icon={CodeIcon}
|
||||
imgUrl="https://assets.roadmap.sh/guest/coding-environment.png"
|
||||
description="With the integrated IDE, you can practice your SQL queries in real-time, getting instant feedback on your results."
|
||||
/>
|
||||
<CourseFeature
|
||||
title="Practical Challenges"
|
||||
icon={FileQuestionIcon}
|
||||
imgUrl="https://assets.roadmap.sh/guest/coding-challenges.png"
|
||||
description="The course is packed with practical challenges and quizzes, allowing you to test your knowledge and skills."
|
||||
/>
|
||||
<CourseFeature
|
||||
title="AI Instructor"
|
||||
icon={BrainIcon}
|
||||
description="Powerful AI tutor to help you with your queries, provide additional explanations and help if you get stuck."
|
||||
imgUrl="https://assets.roadmap.sh/guest/ai-integration.png"
|
||||
/>
|
||||
<CourseFeature
|
||||
title="Take Notes"
|
||||
icon={ClipboardIcon}
|
||||
description="The course allows you to take notes, where you can write down your thoughts and ideas. You can visit them later to review your progress."
|
||||
imgUrl="https://assets.roadmap.sh/guest/course-notes.png"
|
||||
/>
|
||||
<CourseFeature
|
||||
title="Completion Certificate"
|
||||
icon={FileCheckIcon}
|
||||
imgUrl="https://assets.roadmap.sh/guest/course-certificate.jpg"
|
||||
description="The course provides a completion certificate, which you can share with your potential employers."
|
||||
/>
|
||||
</div>
|
||||
</div>
|
||||
|
||||
<div className="mt-7 w-full max-w-3xl text-left md:mt-9">
|
||||
<p className="text-lg leading-normal md:text-xl">
|
||||
Oh, and you get the{' '}
|
||||
<span className="bg-gradient-to-r from-yellow-500 to-yellow-300 bg-clip-text text-transparent">
|
||||
lifetime access
|
||||
</span>{' '}
|
||||
to the course including all the future updates. Also, there is a
|
||||
certificate of completion which you can share with your potential
|
||||
employers.
|
||||
</p>
|
||||
</div>
|
||||
|
||||
<SectionHeader
|
||||
title="Course Overview"
|
||||
description="The course is designed to help you go from SQL beginner to expert
|
||||
through hands-on practice with real-world scenarios, mastering
|
||||
everything from basic to complex queries."
|
||||
className="mt-8 md:mt-24"
|
||||
/>
|
||||
|
||||
<div className="mt-8 w-full max-w-3xl space-y-4 md:mt-12">
|
||||
{chapters.map((chapter, index) => (
|
||||
<ChapterRow key={index} counter={index + 1} {...chapter} />
|
||||
))}
|
||||
</div>
|
||||
|
||||
<SectionHeader
|
||||
title="About the Author"
|
||||
className="mt-12 md:mt-24"
|
||||
description={
|
||||
<div className="mt-2 flex flex-col gap-4 text-lg leading-[1.52] md:mt-4 md:gap-6 md:text-xl">
|
||||
<p>
|
||||
I am Kamran Ahmed, an engineering leader with over a decade of
|
||||
experience in the tech industry. Throughout my career I have built
|
||||
and scaled software systems, architected complex data systems, and
|
||||
worked with large amounts of data to create efficient solutions.
|
||||
</p>
|
||||
<p>
|
||||
I am also the creator of{' '}
|
||||
<a
|
||||
href="https://roadmap.sh"
|
||||
target="_blank"
|
||||
className="text-yellow-400"
|
||||
>
|
||||
roadmap.sh
|
||||
</a>
|
||||
, a platform trusted by millions of developers to guide their
|
||||
learning journeys. I love to simplify complex topics and make
|
||||
learning practical and accessible.
|
||||
</p>
|
||||
<p>
|
||||
In this course, I will share everything I have learned about SQL
|
||||
from the basics to advanced concepts in a way that is easy to
|
||||
understand and apply. Whether you are just starting or looking to
|
||||
sharpen your skills, you are in the right place.
|
||||
</p>
|
||||
</div>
|
||||
}
|
||||
/>
|
||||
|
||||
<CourseAuthor />
|
||||
|
||||
<FAQSection />
|
||||
|
||||
<FloatingPurchase />
|
||||
</div>
|
||||
);
|
||||
}
|
||||
@@ -1,29 +0,0 @@
|
||||
import { cn } from '../../lib/classname';
|
||||
|
||||
type SectionHeaderProps = {
|
||||
title: string;
|
||||
description: string | React.ReactNode;
|
||||
className?: string;
|
||||
};
|
||||
|
||||
export function SectionHeader(props: SectionHeaderProps) {
|
||||
const { title, description, className } = props;
|
||||
|
||||
return (
|
||||
<div className={cn('mx-auto w-full mt-24 max-w-3xl', className)}>
|
||||
<div className="relative w-full">
|
||||
<div className="flex items-center gap-6">
|
||||
<div className="inline-flex items-center rounded-xl ">
|
||||
<span className="text-2xl md:text-3xl font-medium text-zinc-200">{title}</span>
|
||||
</div>
|
||||
<div className="h-[1px] flex-grow bg-gradient-to-r from-yellow-500/20 to-transparent"></div>
|
||||
</div>
|
||||
</div>
|
||||
{typeof description === 'string' ? (
|
||||
<p className="mt-2 md:mt-5 text-lg md:text-xl text-zinc-400">{description}</p>
|
||||
) : (
|
||||
description
|
||||
)}
|
||||
</div>
|
||||
);
|
||||
}
|
||||
@@ -1,57 +0,0 @@
|
||||
import { cn } from '../../lib/classname';
|
||||
|
||||
type SpotlightProps = {
|
||||
className?: string;
|
||||
fill?: string;
|
||||
};
|
||||
|
||||
export function Spotlight(props: SpotlightProps) {
|
||||
const { className, fill } = props;
|
||||
|
||||
return (
|
||||
<svg
|
||||
className={cn(
|
||||
'animate-spotlight pointer-events-none absolute z-[1] h-[169%] w-[238%] opacity-0 lg:w-[138%]',
|
||||
className,
|
||||
)}
|
||||
xmlns="http://www.w3.org/2000/svg"
|
||||
viewBox="0 0 3787 2842"
|
||||
fill="none"
|
||||
>
|
||||
<g filter="url(#filter)">
|
||||
<ellipse
|
||||
cx="1924.71"
|
||||
cy="273.501"
|
||||
rx="1924.71"
|
||||
ry="273.501"
|
||||
transform="matrix(-0.822377 -0.568943 -0.568943 0.822377 3631.88 2291.09)"
|
||||
fill={fill || 'white'}
|
||||
fillOpacity="0.21"
|
||||
></ellipse>
|
||||
</g>
|
||||
<defs>
|
||||
<filter
|
||||
id="filter"
|
||||
x="0.860352"
|
||||
y="0.838989"
|
||||
width="3785.16"
|
||||
height="2840.26"
|
||||
filterUnits="userSpaceOnUse"
|
||||
colorInterpolationFilters="sRGB"
|
||||
>
|
||||
<feFlood floodOpacity="0" result="BackgroundImageFix"></feFlood>
|
||||
<feBlend
|
||||
mode="normal"
|
||||
in="SourceGraphic"
|
||||
in2="BackgroundImageFix"
|
||||
result="shape"
|
||||
></feBlend>
|
||||
<feGaussianBlur
|
||||
stdDeviation="151"
|
||||
result="effect1_foregroundBlur_1065_8"
|
||||
></feGaussianBlur>
|
||||
</filter>
|
||||
</defs>
|
||||
</svg>
|
||||
);
|
||||
}
|
||||
34
src/components/ShareIcons/ShareIcons.astro
Normal file
34
src/components/ShareIcons/ShareIcons.astro
Normal file
@@ -0,0 +1,34 @@
|
||||
---
|
||||
import Icon from '../AstroIcon.astro';
|
||||
|
||||
export interface Props {
|
||||
pageUrl: string;
|
||||
description: string;
|
||||
}
|
||||
|
||||
const { pageUrl, description } = Astro.props;
|
||||
|
||||
const twitterUrl = `https://twitter.com/intent/tweet?text=${description}&url=${pageUrl}`;
|
||||
const fbUrl = `https://www.facebook.com/sharer/sharer.php?quote=${description}&u=${pageUrl}`;
|
||||
const hnUrl = `https://news.ycombinator.com/submitlink?t=${description}&u=${pageUrl}`;
|
||||
const redditUrl = `https://www.reddit.com/submit?title=${description}&url=${pageUrl}`;
|
||||
---
|
||||
|
||||
<div class='absolute left-[-18px] top-[110px] h-full hidden' id='page-share-icons'>
|
||||
<div class='flex sticky top-[100px] flex-col gap-1.5 items-center'>
|
||||
<a href={twitterUrl} target='_blank' class='text-gray-500 hover:text-gray-700 mb-0.5'>
|
||||
<Icon icon='twitter' />
|
||||
</a>
|
||||
<a href={fbUrl} target='_blank' class='text-gray-500 hover:text-gray-700'>
|
||||
<Icon icon='facebook' />
|
||||
</a>
|
||||
<a href={hnUrl} target='_blank' class='text-gray-500 hover:text-gray-700'>
|
||||
<Icon icon='hackernews' />
|
||||
</a>
|
||||
<a href={redditUrl} target='_blank' class='text-gray-500 hover:text-gray-700'>
|
||||
<Icon icon='reddit' />
|
||||
</a>
|
||||
</div>
|
||||
</div>
|
||||
|
||||
<script src='./sharer.js'></script>
|
||||
@@ -1,105 +0,0 @@
|
||||
import { useEffect, useRef } from 'react';
|
||||
import { cn } from '../../lib/classname';
|
||||
import { FacebookIcon } from '../ReactIcons/FacebookIcon';
|
||||
import { HackerNewsIcon } from '../ReactIcons/HackerNewsIcon';
|
||||
import { RedditIcon } from '../ReactIcons/RedditIcon';
|
||||
import { TwitterIcon } from '../ReactIcons/TwitterIcon';
|
||||
|
||||
type ShareIconsProps = {
|
||||
resourceId: string;
|
||||
resourceType: string;
|
||||
pageUrl: string;
|
||||
description: string;
|
||||
};
|
||||
|
||||
export function ShareIcons(props: ShareIconsProps) {
|
||||
const { pageUrl, description, resourceType, resourceId } = props;
|
||||
|
||||
const shareIconsRef = useRef<HTMLDivElement>(null);
|
||||
|
||||
const twitterUrl = `https://twitter.com/intent/tweet?text=${description}&url=${pageUrl}`;
|
||||
const fbUrl = `https://www.facebook.com/sharer/sharer.php?quote=${description}&u=${pageUrl}`;
|
||||
const hnUrl = `https://news.ycombinator.com/submitlink?t=${description}&u=${pageUrl}`;
|
||||
const redditUrl = `https://www.reddit.com/submit?title=${description}&url=${pageUrl}`;
|
||||
|
||||
const icons = [
|
||||
{
|
||||
url: twitterUrl,
|
||||
icon: (
|
||||
<TwitterIcon
|
||||
className="size-[24px] [&>path]:fill-[#E5E5E5]"
|
||||
boxColor="currentColor"
|
||||
/>
|
||||
),
|
||||
},
|
||||
{
|
||||
url: fbUrl,
|
||||
icon: <FacebookIcon className="size-[26px]" />,
|
||||
},
|
||||
{
|
||||
url: hnUrl,
|
||||
icon: <HackerNewsIcon className="size-[26px]" />,
|
||||
},
|
||||
{
|
||||
url: redditUrl,
|
||||
icon: <RedditIcon className="size-[26px]" />,
|
||||
},
|
||||
];
|
||||
|
||||
useEffect(() => {
|
||||
const shareIcons = shareIconsRef.current;
|
||||
if (!shareIcons) {
|
||||
return;
|
||||
}
|
||||
|
||||
const onScroll = () => {
|
||||
if (window.scrollY < 100 || window.innerWidth < 1050) {
|
||||
shareIcons.classList.add('hidden');
|
||||
return null;
|
||||
}
|
||||
|
||||
shareIcons.classList.remove('hidden');
|
||||
};
|
||||
|
||||
onScroll();
|
||||
|
||||
window.addEventListener('scroll', onScroll);
|
||||
return () => {
|
||||
window.removeEventListener('scroll', onScroll);
|
||||
};
|
||||
}, []);
|
||||
|
||||
return (
|
||||
<div
|
||||
className="absolute left-[-18px] top-[110px] hidden h-full"
|
||||
ref={shareIconsRef}
|
||||
>
|
||||
<div className="sticky top-[100px] flex flex-col items-center gap-1.5">
|
||||
{icons.map((icon, index) => {
|
||||
const host = new URL(icon.url).host;
|
||||
|
||||
return (
|
||||
<a
|
||||
key={index}
|
||||
href={icon.url}
|
||||
target="_blank"
|
||||
className={cn(
|
||||
'text-gray-500 hover:text-gray-700',
|
||||
index === 0 && 'mt-0.5',
|
||||
)}
|
||||
onClick={() => {
|
||||
window.fireEvent({
|
||||
category: 'RoadmapShareLink',
|
||||
action: `Share Roadmap / ${resourceType} / ${resourceId} / ${host}`,
|
||||
label: icon.url,
|
||||
});
|
||||
}}
|
||||
>
|
||||
{icon.icon}
|
||||
</a>
|
||||
);
|
||||
})}
|
||||
</div>
|
||||
</div>
|
||||
);
|
||||
}
|
||||
32
src/components/ShareIcons/sharer.js
Normal file
32
src/components/ShareIcons/sharer.js
Normal file
@@ -0,0 +1,32 @@
|
||||
export class Sharer {
|
||||
constructor() {
|
||||
this.init = this.init.bind(this);
|
||||
this.onScroll = this.onScroll.bind(this);
|
||||
|
||||
this.shareIconsId = 'page-share-icons';
|
||||
}
|
||||
|
||||
get shareIconsEl() {
|
||||
return document.getElementById(this.shareIconsId);
|
||||
}
|
||||
|
||||
onScroll() {
|
||||
if (window.scrollY < 100 || window.innerWidth < 1050) {
|
||||
this.shareIconsEl.classList.add('hidden');
|
||||
return null;
|
||||
}
|
||||
|
||||
this.shareIconsEl.classList.remove('hidden');
|
||||
}
|
||||
|
||||
init() {
|
||||
if (!this.shareIconsEl) {
|
||||
return;
|
||||
}
|
||||
|
||||
window.addEventListener('scroll', this.onScroll, { passive: true });
|
||||
}
|
||||
}
|
||||
|
||||
const sharer = new Sharer();
|
||||
sharer.init();
|
||||
@@ -1,15 +1,16 @@
|
||||
import { useStore } from '@nanostores/react';
|
||||
import { useEffect, useState } from 'react';
|
||||
import { useAuth } from '../../hooks/use-auth';
|
||||
import { useToast } from '../../hooks/use-toast';
|
||||
import { getUrlParams, setUrlParams } from '../../lib/browser';
|
||||
import { httpGet } from '../../lib/http';
|
||||
import { pageProgressMessage } from '../../stores/page';
|
||||
import { MemberProgressItem } from './MemberProgressItem';
|
||||
import { useToast } from '../../hooks/use-toast';
|
||||
import { useStore } from '@nanostores/react';
|
||||
import { $currentTeam } from '../../stores/team';
|
||||
import { GroupRoadmapItem } from './GroupRoadmapItem';
|
||||
import { MemberCustomProgressModal } from './MemberCustomProgressModal';
|
||||
import { MemberProgressItem } from './MemberProgressItem';
|
||||
import { getUrlParams, setUrlParams } from '../../lib/browser';
|
||||
import { useAuth } from '../../hooks/use-auth';
|
||||
import { MemberProgressModal } from './MemberProgressModal';
|
||||
import { MemberCustomProgressModal } from './MemberCustomProgressModal';
|
||||
import { canManageCurrentRoadmap } from '../../stores/roadmap.ts';
|
||||
|
||||
export type UserProgress = {
|
||||
resourceTitle: string;
|
||||
|
||||
@@ -108,6 +108,7 @@ export function TopicProgressButton(props: TopicProgressButtonProps) {
|
||||
useKeydown(
|
||||
'r',
|
||||
() => {
|
||||
console.log(progress);
|
||||
if (progress === 'pending') {
|
||||
onClose();
|
||||
return;
|
||||
|
||||
40
src/components/VideoListItem.astro
Normal file
40
src/components/VideoListItem.astro
Normal file
@@ -0,0 +1,40 @@
|
||||
---
|
||||
import type { VideoFileType } from '../lib/video';
|
||||
|
||||
export interface Props {
|
||||
video: VideoFileType;
|
||||
}
|
||||
|
||||
const { video } = Astro.props;
|
||||
const { frontmatter, id } = video;
|
||||
---
|
||||
|
||||
<a
|
||||
class:list={[
|
||||
'block no-underline py-2 group text-md items-center text-gray-600 hover:text-blue-600 flex justify-between border-b',
|
||||
]}
|
||||
href={`/videos/${id}`}
|
||||
>
|
||||
<span class='group-hover:translate-x-2 transition-transform'>
|
||||
{frontmatter.title}
|
||||
|
||||
{
|
||||
frontmatter.isNew && (
|
||||
<span class='bg-green-300 text-green-900 text-xs font-medium px-1.5 py-0.5 rounded-sm uppercase ml-1.5'>
|
||||
New
|
||||
<span class='hidden sm:inline'>
|
||||
·
|
||||
{new Date(frontmatter.date).toLocaleString('default', {
|
||||
month: 'long',
|
||||
})}
|
||||
</span>
|
||||
</span>
|
||||
)
|
||||
}
|
||||
</span>
|
||||
<span class='capitalize text-gray-500 text-xs hidden sm:block'>
|
||||
{frontmatter.duration}
|
||||
</span>
|
||||
|
||||
<span class='text-gray-400 text-xs block sm:hidden'> »</span>
|
||||
</a>
|
||||
@@ -4,7 +4,7 @@ pdfUrl: '/pdfs/best-practices/backend-performance.pdf'
|
||||
order: 1
|
||||
briefTitle: 'Backend Performance'
|
||||
briefDescription: 'Backend Performance Best Practices'
|
||||
isNew: false
|
||||
isNew: true
|
||||
isUpcoming: false
|
||||
title: 'Backend Performance Best Practices'
|
||||
description: 'Detailed list of best practices to improve your backend performance'
|
||||
|
||||
@@ -1,19 +0,0 @@
|
||||
---
|
||||
title: "Our first paid course about SQL is live"
|
||||
description: 'We just launched our first paid SQL course'
|
||||
images:
|
||||
"SQL Course": "https://assets.roadmap.sh/guest/course-environment-87jg8.png"
|
||||
"Course Creator Platform": "https://assets.roadmap.sh/guest/course-creator-platform.png"
|
||||
seo:
|
||||
title: 'SQL Course is Live'
|
||||
description: ''
|
||||
date: 2025-02-04
|
||||
---
|
||||
|
||||
After months of work, I am excited to announce our [brand-new SQL course](/courses/sql) designed to help you master SQL with a hands-on, practical approach!
|
||||
|
||||
For the past few months, we have been working on building a course platform that would not only help us deliver high-quality educational content but also sustain the development of roadmap.sh. This SQL course is our first step in that direction.
|
||||
|
||||
The course has been designed with a focus on practical learning. Each topic is accompanied by hands-on exercises, real-world examples, and an integrated coding environment where you can practice what you learn. The AI integration provides personalized learning assistance, helping you grasp concepts better and faster.
|
||||
|
||||
Check out the course at [roadmap.sh/courses/sql](https://roadmap.sh/courses/sql)
|
||||
@@ -1,198 +0,0 @@
|
||||
---
|
||||
title: 'Is Data Science a Good Career? Advice From a Pro'
|
||||
description: 'Is data science a good career choice? Learn from a professional about the benefits, growth potential, and how to thrive in this exciting field.'
|
||||
authorId: fernando
|
||||
excludedBySlug: '/ai-data-scientist/career-path'
|
||||
seo:
|
||||
title: 'Is Data Science a Good Career? Advice From a Pro'
|
||||
description: 'Is data science a good career choice? Learn from a professional about the benefits, growth potential, and how to thrive in this exciting field.'
|
||||
ogImageUrl: 'https://assets.roadmap.sh/guest/is-data-science-a-good-career-10j3j.jpg'
|
||||
isNew: true
|
||||
type: 'textual'
|
||||
date: 2025-01-28
|
||||
sitemap:
|
||||
priority: 0.7
|
||||
changefreq: 'weekly'
|
||||
tags:
|
||||
- 'guide'
|
||||
- 'textual-guide'
|
||||
- 'guide-sitemap'
|
||||
---
|
||||
|
||||

|
||||
|
||||
Data science is one of the most talked-about career paths today, but is it the right fit for you?
|
||||
|
||||
With [data science](https://roadmap.sh/ai-data-scientist) at the intersection of technology, creativity, and impact, it can be a very appealing role. It definitely promises high and competitive salaries, and the chance to solve real-world problems. Who would say “no” to that?\!
|
||||
|
||||
But is it the right fit for your skills and aspirations?
|
||||
|
||||
In this guide, I’ll help you uncover the answer to that question by understanding the pros and cons of working as a data scientist. I’ll also look at what the data scientists’ salaries are like and the type of skills you’d need to have to succeed at the job.
|
||||
|
||||
Now sit down, relax, and read carefully, because I’m about to help you answer the question of “Is data science a good career for me?”.
|
||||
|
||||
## Pros of a Career in Data Science
|
||||
|
||||

|
||||
|
||||
There are plenty of “pros” when it comes to picking data science as your career, but let’s take a closer look at the main ones.
|
||||
|
||||
### High Demand and Job Security
|
||||
|
||||
The demand for data scientists has grown exponentially over the past few years and shows no signs of slowing down. According to the [U.S. Bureau of Labor Statistics](https://www.bls.gov/ooh/math/data-scientists.htm), the data science job market is projected to grow by 36% from 2023 to 2033, far outpacing the average for other fields.
|
||||
|
||||
This surge is partly due to the “explosion” of artificial intelligence, particularly tools like ChatGPT, in recent years, which have amplified the need for skilled data scientists to handle complex machine learning models and big data analysis.
|
||||
|
||||
### Competitive Salaries
|
||||
|
||||
One of the most appealing aspects of data science positions is the average data scientist’s salary. Reports from Glassdoor and Indeed highlight that data scientists are among the highest-paid professionals in the technology sector. For example, the national average salary for a data scientist in the United States is approximately $120,000 annually, with experienced professionals earning significantly more.
|
||||
|
||||
These salaries are a reflection of the reality: the high demand for [data science skills](https://roadmap.sh/ai-data-scientist/skills) and the technical expertise required for these roles are not easy to come by. What’s even more, companies in high-cost regions, such as Silicon Valley, New York City, and Seattle, tend to offer premium salaries to attract top talent.
|
||||
|
||||
The financial rewards in this field are usually complemented by additional benefits such as opportunities for professional development like research, publishing, patent registration, etc.
|
||||
|
||||
### Intellectual Challenge and Learning Opportunities
|
||||
|
||||
Data scientists work in a field that demands continuous learning and adaptation to emerging technologies. Their field is rooted in solving complex problems through a combination of technical knowledge, creativity, and critical thinking. In other words, they rarely have any time to get bored.
|
||||
|
||||
What makes data science important and intellectually rewarding, is its ability to address real-world problems. Whether it's optimizing healthcare systems, enhancing customer experiences in retail, or predicting financial risks, data science applications have a tangible impact on people.
|
||||
|
||||
This makes data science a good career for individuals who are passionate about lifelong learning and intellectual stimulation.
|
||||
|
||||
### Versatility
|
||||
|
||||
Data science is a good career choice for those who enjoy variety and flexibility. One of the unique aspects of a career in data science is its ability to reach across various industries and domains (I’m talking technology, healthcare, finance, e-commerce, and even entertainment to name a few). This means data scientists can apply their data science skills in almost any sector that generates or relies on data—which is virtually all industries today.
|
||||
|
||||
## Cons of a Career in Data Science
|
||||
|
||||

|
||||
|
||||
The data science job is not without its “cons”, after all, there is no “perfect” role out there. Let’s now review some of the potential challenges that come with the role.
|
||||
|
||||
### Steep Learning Curve
|
||||
|
||||
The steep learning curve in data science is one of the field’s defining characteristics. New data scientists have to develop a deep understanding of technical skills, including proficiency in programming languages like Python, R, and SQL, as well as tools for machine learning and data visualization.
|
||||
|
||||
On top of the already complex subjects to master, data scientists need to find ways of staying current with the constant advancements in the field. This is not optional; it’s a necessity for anyone trying to achieve long-term success in data science. This constant evolution can feel overwhelming, especially for newcomers who are also learning foundational skills.
|
||||
|
||||
Despite these challenges, the steep learning curve can be incredibly rewarding for those who are passionate about solving problems, making data-driven decisions, and contributing to impactful projects.
|
||||
|
||||
While it might sound harsh, it’s important to note that the dedication required to overcome these challenges often results in a fulfilling and (extremely) lucrative career in the world of data science.
|
||||
|
||||
### High Expectations
|
||||
|
||||
Data science positions come with high expectations from organizations. Data scientists usually have the huge responsibility of delivering actionable insights and ensuring these insights are both accurate and timely.
|
||||
|
||||
One of the key challenges data science professionals face is managing the pressure to deliver results under tight deadlines (they’re always tight). Stakeholders often expect instant answers to complex problems, which can lead to unrealistic demands.
|
||||
|
||||
To succeed in such environments, skilled data scientists need strong communication skills to explain their findings and set realistic expectations with stakeholders.
|
||||
|
||||
### Potential Burnout
|
||||
|
||||
The high demand for data science skills usually translates into heavy workloads and tight deadlines, particularly for data scientists working on high-stakes projects (working extra hours is also not an uncommon scenario).
|
||||
|
||||
Data scientists frequently juggle multiple complex responsibilities, such as modeling data, developing machine learning algorithms, and conducting statistical analysis—often within limited timeframes.
|
||||
|
||||
The intense focus required for these tasks, combined with overlapping priorities (and a small dose of poor project management), can lead to mental fatigue and stress.
|
||||
|
||||
Work-life balance can also be a challenge for data scientists giving them another reason for burnout. Combine that with highly active industries, like finance and you have a very hard-to-balance combination.
|
||||
|
||||
To mitigate the risk of burnout, data scientists can try to prioritize setting boundaries, managing workloads effectively (when that’s an option), and advocating for clearer role definitions (better separation of concerns).
|
||||
|
||||
## Skills Required for a Data Science Career
|
||||
|
||||

|
||||
|
||||
To develop a successful career in data science, not all of your [skills](https://roadmap.sh/ai-data-scientist/skills) need to be technical, you also have to look at soft skills, and domain knowledge and to have a mentality of lifelong learning.
|
||||
|
||||
Let’s take a closer look.
|
||||
|
||||
### Technical Skills
|
||||
|
||||
The field of data requires strong foundational technical skills. At the core of these skills is proficiency in programming languages such as Python, R, and SQL. Python is particularly useful and liked for its versatility and extensive libraries, while SQL is essential for querying and managing database systems. R remains a popular choice for statistical analysis and data visualization.
|
||||
|
||||
In terms of frameworks, look into TensorFlow, PyTorch, or Scikit-learn. They’re all crucial for building predictive models and implementing artificial intelligence solutions. Tools like Tableau, Power BI, and Matplotlib are fantastic for creating clear and effective data visualizations, which play a significant role in presenting actionable insights.
|
||||
|
||||
### Soft Skills
|
||||
|
||||
As I said before, it’s not all about technical skills. Data scientists must develop their soft skills, this is key in the field.
|
||||
|
||||
From problem-solving and analytical thinking to developing your communication skills and your ability to collaborate with others. They all work together to help you communicate complex insights and results to other, non-technical stakeholders, which is going to be a key activity in your day-to-day life.
|
||||
|
||||
### Domain Knowledge
|
||||
|
||||
While technical and soft skills are essential, domain knowledge often distinguishes exceptional data scientists from the rest. Understanding industry-specific contexts—such as healthcare regulations, financial market trends, or retail customer behavior—enables data scientists to deliver tailored insights that directly address business needs. If you understand your problem space, you understand the needs of your client and the data you’re dealing with.
|
||||
|
||||
Getting that domain knowledge often involves on-the-job experience, targeted research, or additional certifications.
|
||||
|
||||
### Lifelong Learning
|
||||
|
||||
Finally, if you’re going to be a data scientist, you’ll need to embrace a mindset of continuous learning. The field evolves rapidly, with emerging technologies, tools, and methodologies reshaping best practices. Staying competitive requires consistent professional development through online courses, certifications, conferences, and engagement with the broader data science community.
|
||||
|
||||
Lifelong learning is not just a necessity but also an opportunity to remain excited and engaged in a dynamic and rewarding career.
|
||||
|
||||
## How to determine if data science is right for you?
|
||||
|
||||

|
||||
|
||||
How can you tell if you’ll actually enjoy working as a data scientist? Even after reading this far, you might still have some doubts. So in this section, I’m going to look at some ways in which you can validate that you’ll enjoy the job of a data scientist before you go through the process of becoming one.
|
||||
|
||||
### Self-Assessment Questions
|
||||
|
||||
Figuring out whether data science is the right career path starts with introspection. Ask yourself the following:
|
||||
|
||||
* Do you enjoy working with numbers and solving complex problems?
|
||||
* Are you comfortable learning and applying programming skills like Python and SQL?
|
||||
* Are you excited by the idea of using algorithms to create data-driven insights and actionable recommendations?
|
||||
* Are you willing to commit to continuous learning in a fast-evolving field?
|
||||
|
||||
Take your time while you think about these questions. You don’t even need a full answer, just try to understand how you feel about the idea of each one. If you don’t feel like saying “yes”, then chances are, this might not be the right path for you (and that’s completely fine\!).
|
||||
|
||||
### Start with Small Projects
|
||||
|
||||
If self-assessment is not your thing, another great way to explore your interest in data science is to dive into small, manageable projects. Platforms like Kaggle offer competitions and publicly available data sets, allowing you to practice exploratory data analysis, data visualization, and predictive modeling. Working on these projects can help you build a portfolio, develop confidence in your skills, and validate that you effectively like working this way.
|
||||
|
||||
Online courses and certifications in data analytics, machine learning, and programming languages provide a structured way to build foundational knowledge. Resources like Coursera, edX, and DataCamp offer beginner-friendly paths to learning data science fundamentals.
|
||||
|
||||
### Network and Seek Mentorship
|
||||
|
||||
Another great way to understand if you would like to be a data scientist, is to ask other data scientists. It might sound basic, but it’s a very powerful way because you’ll get insights about the field from the source.
|
||||
|
||||
Networking, while not easy for everyone, is a key component of entering the data science field. Go to data science meetups, webinars, or conferences to expand your network and stay updated on emerging trends and technologies.
|
||||
|
||||
If you’re not into big groups, try seeking mentorship from data scientists already working in the field. This can accelerate your learning curve. Mentors can offer guidance on career planning, project selection, and skill development.
|
||||
|
||||
## Alternative career paths to consider
|
||||
|
||||

|
||||
|
||||
Not everyone who is interested in data science wants to pursue the full spectrum of technical skills or the specific responsibilities of a data scientist. Lucky for you, there are several related career paths that can still scratch your itch for fun and interesting challenges while working within the data ecosystem.
|
||||
|
||||
### Data-Adjacent Roles
|
||||
|
||||
* **Data Analyst**: If you enjoy working with data but prefer focusing on interpreting and visualizing it to inform business decisions, a data analyst role might be for you. Data analysts primarily work on identifying trends and providing actionable recommendations without diving deeply into machine learning or predictive modeling.
|
||||
* **Data Engineer**: If you’re more inclined toward building the infrastructure that makes data science possible, consider becoming a data engineer. These data professionals design, build, and maintain data pipelines, ensuring the accessibility and reliability of large data sets for analysis. The role requires expertise in database systems, data structures, and programming.
|
||||
|
||||
### Related Fields
|
||||
|
||||
* **Software Engineering**: For those who enjoy coding and software development but want to remain close to data-related projects, software engineering offers opportunities to build tools, applications, and systems that support data analysis and visualization.
|
||||
* **Cybersecurity**: With the increasing emphasis on data privacy and security, cybersecurity professionals play a critical role in protecting sensitive information. This field combines technical knowledge with policy enforcement, making it appealing to those interested in data protection and regulatory compliance.
|
||||
|
||||
### Non-Technical Roles in the Data Ecosystem
|
||||
|
||||
* **Data Governance**: If instead of transforming data and getting insights, you’d like to focus more on how the data is governed (accessed, controlled, cataloged, etc), then this might be the role for you. This role is essential for ensuring that an organization’s data assets are used effectively and responsibly.
|
||||
* **Data Privacy Office**: In a similar vein to a data governance officer, the data privacy officer cares for the actual privacy of the data. With the rise of AI, data is more relevant than ever, and controlling that you comply with regulations like GDPR and CCPA, is critical for organizations. This role focuses on data privacy strategies, audits, and risk management, making it an excellent fit for those interested in the legal and ethical aspects of data.
|
||||
|
||||
## Next steps
|
||||
|
||||

|
||||
|
||||
Data science is a promising career path offering high demand, competitive salaries, and multiple opportunities across various industries. Its ability to address real-world problems, combined with the intellectual challenge it presents, makes it an attractive choice for many. However, it also makes it a very difficult and taxing profession for those who don’t enjoy this type of challenge.
|
||||
|
||||
There are many potential next steps for you to take and answer the question of “Is data science a good career?”.
|
||||
|
||||
For example, you can reflect on your interests and strengths. Ask yourself whether or not you enjoy problem-solving, working with data sets, and learning new technologies. Use this reflection to determine if data science aligns with your career goals.
|
||||
|
||||
You can also consume resources like the [AI/Data Scientist roadmap](https://roadmap.sh/ai-data-scientist) and the [Data Analyst roadmap](https://roadmap.sh/data-analyst), as they offer a clear progression for developing essential skills, so check them out. These tools can help you identify which areas to focus on based on your current expertise and interests.
|
||||
|
||||
In the end, just remember: data science is rapidly evolving so make sure to stay engaged by reading research papers, following industry blogs, or attending conferences. Anything you can do will help, just figure out what works for you and keep doing it.
|
||||
@@ -1,200 +0,0 @@
|
||||
---
|
||||
title: "Data Science Lifecycle 101: A Beginners' Ultimate Guide"
|
||||
description: 'Discover the Data Science Lifecycle step-by-step: Learn key phases, tools, and techniques in this beginner-friendly guide.'
|
||||
authorId: fernando
|
||||
excludedBySlug: '/ai-data-scientist/career-path'
|
||||
seo:
|
||||
title: "Data Science Lifecycle 101: A Beginners' Ultimate Guide"
|
||||
description: 'Discover the Data Science Lifecycle step-by-step: Learn key phases, tools, and techniques in this beginner-friendly guide.'
|
||||
ogImageUrl: 'https://assets.roadmap.sh/guest/data-science-lifecycle-eib3s.jpg'
|
||||
isNew: true
|
||||
type: 'textual'
|
||||
date: 2025-01-29
|
||||
sitemap:
|
||||
priority: 0.7
|
||||
changefreq: 'weekly'
|
||||
tags:
|
||||
- 'guide'
|
||||
- 'textual-guide'
|
||||
- 'guide-sitemap'
|
||||
---
|
||||
|
||||

|
||||
|
||||
Developing a data science project, from beginning to production is not a trivial task. It involves so many steps and so many complex tasks, that without some guardrails, releasing to production becomes ten times harder.
|
||||
|
||||
Here’s where the data science lifecycle comes into play. It brings a structured approach so that [data scientists](https://roadmap.sh/ai-data-scientist), data analysts, and others can move forward together from raw data to actionable insights.
|
||||
|
||||
In this guide, we’ll cover everything you need to know about the data science lifecycle, its many variants, and how to pick the right one for your project.
|
||||
|
||||
So let’s get going\!
|
||||
|
||||
## Core Concepts of a Lifecycle
|
||||
|
||||

|
||||
|
||||
To fully understand the concept of the lifecycle, we have to look at the core concepts inside this framework, and how they contribute to the delivery of a successful data science project.
|
||||
|
||||
### Problem Definition
|
||||
|
||||
Every data science project begins with a clear definition of the problem to be solved. This involves collaborating with key stakeholders to identify objectives and desired outcomes. Data scientists must understand the context and scope of the project to ensure that the goals align with business or research needs.
|
||||
|
||||
### Data Collection
|
||||
|
||||
In the data collection phase, data scientists and data engineers work together and gather relevant data from diverse data sources. This includes both structured and unstructured data, such as historical records, new data, or data streams.
|
||||
|
||||
The process ensures the integration of all pertinent data, creating a robust dataset for the following stages. Data acquisition tools and strategies play a critical role in this phase.
|
||||
|
||||
### Data Preparation
|
||||
|
||||
This stage addresses the quality of raw data by cleaning and organizing it for analysis. Tasks such as treating inaccurate data, handling missing values, and converting raw data into usable formats are central to this stage. This stage prepares the data for further and more detailed analysis.
|
||||
|
||||
### Exploratory Data Analysis (EDA)
|
||||
|
||||
The exploratory data analysis stage is where the “data processing” happens. This stage focuses on uncovering patterns, trends, and relationships within the data. Through data visualization techniques such as bar graphs and statistical models, data scientists perform a thorough data analysis and gain insights into the data’s structure and characteristics.
|
||||
|
||||
Like every stage so far, this one lays the foundation for the upcoming stages. In this particular case, after performing a detailed EDA, data scientists have a much better understanding of the data they have to work with, and a pretty good idea of what they can do with it now.
|
||||
|
||||
### Model Building and Evaluation
|
||||
|
||||
The model building phase involves developing predictive or machine learning models tailored to the defined problem. Data scientists experiment with various machine learning algorithms and statistical models to determine the best approach. Here’s where data modeling happens, bridging the insights gained during the exploratory data analysis (EDA) phase with actionable predictions and outcomes used in the deployment phase.
|
||||
|
||||
Model evaluation follows, where the performance and accuracy of these models are tested to ensure reliability.
|
||||
|
||||
### Deployment and Monitoring
|
||||
|
||||
The final stage of this generic data science lifecycle involves deploying the model into a production environment. Here, data scientists, machine learning engineers, and quality assurance teams ensure that the model operates effectively within existing software systems.
|
||||
|
||||
After this stage, continuous monitoring and maintenance are essential to address new data or changing conditions, which can impact the performance and accuracy of the model.
|
||||
|
||||
## Exploring 6 Popular Lifecycle Variants
|
||||
|
||||

|
||||
|
||||
The data science lifecycle offers various frameworks tailored to specific needs and contexts. Below, we explore six prominent variants:
|
||||
|
||||
### CRISP-DM (Cross Industry Standard Process for Data Mining)
|
||||
|
||||
CRISP-DM is one of the most widely used frameworks in data science projects, especially within business contexts.
|
||||
|
||||
It organizes the lifecycle into six stages: Business Understanding, Data Understanding, Data Preparation, Modeling, Evaluation, and Deployment.
|
||||
|
||||
This iterative approach allows teams to revisit and refine previous steps as new insights emerge. CRISP-DM is ideal for projects where aligning technical efforts with business goals is very important.
|
||||
|
||||
**Example use case**: A retail company wants to improve customer segmentation for targeted marketing campaigns. Using CRISP-DM, the team starts with business understanding to define segmentation goals, gathers transaction and demographic data, prepares and cleans it, builds clustering models, evaluates their performance, and deploys the best model to group customers for personalized offers.
|
||||
|
||||
### KDD (Knowledge Discovery in Databases)
|
||||
|
||||
The KDD process focuses on extracting useful knowledge from large datasets. Its stages include Selection, Preprocessing, Transformation, Data Mining, and Interpretation/Evaluation.
|
||||
|
||||
KDD emphasizes the academic and research-oriented aspects of data science, making it an ideal choice for experimental or exploratory projects in scientific domains. It offers a systematic approach to discovering patterns and insights in complex datasets.
|
||||
|
||||
**Example use case:** A research institute analyzes satellite data to study climate patterns. They follow KDD by selecting relevant datasets, preprocessing to remove noise, transforming data to highlight seasonal trends, applying data mining techniques to identify long-term climate changes, and interpreting results to publish findings.
|
||||
|
||||
### Data Analytics Lifecycle
|
||||
|
||||
This specific data science lifecycle is tailored for enterprise-level projects that prioritize actionable insights. It’s composed of six stages: Discovery, Data Preparation, Model Planning, Model Building, Communicating Results, and Operationalizing.
|
||||
|
||||
The framework’s strengths lie in its alignment with business objectives and readiness for model deployment, making it ideal for organizations seeking to integrate data-driven solutions into their operations.
|
||||
|
||||
**Example use case:** A financial institution uses the Data Analytics Lifecycle to detect fraudulent transactions. They discover patterns in historical transaction data, prepare it by cleaning and normalizing, plan predictive models, build and test them, communicate results to fraud prevention teams, and operationalize the model to monitor real-time transactions.
|
||||
|
||||
### SEMMA (Sample, Explore, Modify, Model, Assess)
|
||||
|
||||
SEMMA is a straightforward and tool-centric framework developed by SAS. It focuses on sampling data, exploring it for patterns, modifying it for analysis, modeling it for predictions, and assessing the outcomes.
|
||||
|
||||
This lifecycle is particularly useful for workflows involving specific analytics tools. Its simplicity and strong emphasis on data exploration make it an excellent choice for teams prioritizing rapid insights.
|
||||
|
||||
**Example use case:** A healthcare organization predicts patient readmission rates using SEMMA. They sample data from hospital records, explore patient histories for trends, modify features like patient age and diagnoses, build machine learning models, and assess their accuracy to choose the most effective predictor.
|
||||
|
||||
### Team Data Science Process (TDSP)
|
||||
|
||||
TDSP offers a collaborative and agile framework that organizes the lifecycle into four key stages: Business Understanding, Data Acquisition, Modeling, and Deployment.
|
||||
|
||||
Designed with team-based workflows in mind, TDSP emphasizes iterative progress and adaptability, ensuring that projects align with business needs while remaining flexible to changes. It’s well-suited for scenarios requiring close collaboration among data scientists, engineers, and stakeholders.
|
||||
|
||||
**Example use case:** A logistics company improves delivery route optimization. Using TDSP, the team collaborates to understand business goals, acquires data from GPS and traffic systems, develops routing models, and deploys them to dynamically suggest the fastest delivery routes.
|
||||
|
||||
### MLOps Lifecycle
|
||||
|
||||
MLOps focuses specifically on machine learning operations and production environments. Its stages include Data Engineering, Model Development, Model Deployment, and Monitoring.
|
||||
|
||||
This lifecycle is essential for projects involving large-scale machine learning systems that demand high scalability and automation.
|
||||
|
||||
MLOps integrates seamlessly with continuous integration and delivery pipelines, ensuring that deployed models remain effective and relevant as new data is introduced.
|
||||
|
||||
Each of these frameworks has its own strengths and is suited to different types of data science operations.
|
||||
|
||||
**Example use case:** An e-commerce platform deploys a recommendation engine using MLOps. They engineer data pipelines from user activity logs, develop collaborative filtering models, deploy them on the website, and monitor their performance to retrain models when new user data is added.
|
||||
|
||||
## How to Choose the Right Data Science Lifecycle
|
||||
|
||||

|
||||
|
||||
Determining the most suitable data science lifecycle for your data science project requires a systematic approach. After all, not all lifecycles are best suited for all situations.
|
||||
|
||||
You can follow these steps to identify the framework that aligns best with your goals and resources:
|
||||
|
||||
1. **Define your objectives:** Clearly identify the goals of your project. Are you solving a business problem, conducting academic research, or deploying a machine learning model? Understanding the end objective will narrow down your choices.
|
||||
2. **Assess project complexity:** Evaluate the scope and intricacy of your project. Simple projects may benefit from streamlined frameworks like SEMMA, while complex projects with iterative requirements might need CRISP-DM or TDSP.
|
||||
3. **Evaluate your team composition:** Consider the expertise within your team. A team with strong machine learning skills may benefit from MLOps, whereas a diverse team with varying levels of experience might prefer a more general framework like CRISP-DM.
|
||||
4. **Analyze industry and domain requirements:** Different industries may have unique needs. For example, business-driven projects often align with the Data Analytics Lifecycle, while academic projects might find KDD more suitable.
|
||||
5. **Examine available tools and resources:** Ensure that the tools, software, and infrastructure you have access to are compatible with your chosen lifecycle. Frameworks like SEMMA may require specific tools such as SAS.
|
||||
6. **Match to key stakeholder needs:** Align the lifecycle with the expectations and requirements of stakeholders. A collaborative framework like TDSP can be ideal for projects needing frequent input and iteration with business partners.
|
||||
7. **Run a trial phase:** If possible, test a smaller project or a subset of your current project with the selected framework. This will help you assess its effectiveness and make adjustments as needed.
|
||||
|
||||
Follow these steps and you can identify the lifecycle that not only suits your project but also ensures that your data science process is efficient and productive. Each project is unique, so tailoring the lifecycle to its specific demands is critical to success.
|
||||
|
||||
## Generic Framework for Beginners
|
||||
|
||||

|
||||
|
||||
While there are many different data science lifecycles and ways to tackle data science projects, if you’re just getting started and you’re trying to push your first project into production, relying on a beginner-friendly lifecycle might be a better idea.
|
||||
|
||||
A generic framework for beginners in data science simplifies the lifecycle into manageable steps, making it easier to understand and implement. You can follow these steps to define your new framework:
|
||||
|
||||
### 1\. Define the problem
|
||||
|
||||

|
||||
|
||||
Start by clearly identifying the problem you aim to solve. Consider the objectives and outcomes you want to achieve, and ensure these are aligned with the needs of any stakeholder. This will help focus your efforts during development and set the right expectations with your stakeholders.
|
||||
|
||||
### 2\. Collect and clean data
|
||||
|
||||

|
||||
|
||||
Gather data from reliable and relevant sources. During this stage, focus on ensuring data quality by treating inaccurate data, filling in missing values, validating and removing potential data biases and finally, converting raw data into usable formats.
|
||||
|
||||
### 3\. Analyze and visualize
|
||||
|
||||

|
||||
|
||||
Explore the data to uncover patterns, trends, and insights. Use simple data visualization techniques such as bar graphs and scatter plots, along with basic statistical methods, to gain a deeper understanding of the dataset’s structure and variables.
|
||||
|
||||
### 4\. Build and evaluate a model
|
||||
|
||||

|
||||
|
||||
Develop a basic predictive model using accessible machine learning or statistical tools. Test the model’s performance to ensure it meets the objectives defined earlier during step 1\. For beginners, tools with user-friendly interfaces like Python libraries or Excel can be highly effective.
|
||||
|
||||
### 5\. Share results and deploy
|
||||
|
||||

|
||||
|
||||
Present your findings to stakeholders in a clear and actionable format. If applicable, deploy the model into a small-scale production environment to observe its impact and gather feedback for further improvement.
|
||||
|
||||
**Tips for small projects:** Start with a problem you’re familiar with, such as analyzing personal expenses or predicting simple outcomes. Focus on learning the process rather than achieving perfect results. Use open-source tools and resources to experiment and build your confidence.
|
||||
|
||||
Use this framework if this is your first data science project, evaluate your results, and most importantly, reflect on your experience.
|
||||
|
||||
Take those insights into your next project and decide if for that one you would actually benefit from using one of the predefined standard lifecycles mentioned above.
|
||||
|
||||
## Conclusion
|
||||
|
||||
The data science lifecycle is a cornerstone of modern data science. By understanding its stages and principles, professionals can navigate the complexities of data science projects with confidence.
|
||||
|
||||
Regardless of what you’re doing, dealing with unstructured data, creating models, or deploying machine learning algorithms, the lifecycle provides a roadmap for success.
|
||||
|
||||
As data science experts and teams continue to explore and refine their approaches, the lifecycle framework remains a key tool for achieving excellence in any and all operations.
|
||||
|
||||
Finally, remember that if you’re interested in developing your data science career, you have our [data scientist](https://roadmap.sh/ai-data-scientist) and [data analyst](https://roadmap.sh/data-analyst) roadmaps at your disposal. These roadmaps will help you focus your learning time on the really important and relevant topics.
|
||||
@@ -1,197 +0,0 @@
|
||||
---
|
||||
title: 'Top 11 Data Sience Skills to Master in @currentYear@'
|
||||
description: 'Looking to excel in data science? Learn the must-have skills for @currentYear@ with our expert guide and advance your data science career.'
|
||||
authorId: fernando
|
||||
excludedBySlug: '/ai-data-scientist/skills'
|
||||
seo:
|
||||
title: 'Top 11 Data Sience Skills to Master in @currentYear@'
|
||||
description: 'Looking to excel in data science? Learn the must-have skills for @currentYear@ with our expert guide and advance your data science career.'
|
||||
ogImageUrl: 'https://assets.roadmap.sh/guest/data-science-skills-to-master-q36qn.jpg'
|
||||
isNew: true
|
||||
type: 'textual'
|
||||
date: 2025-01-28
|
||||
sitemap:
|
||||
priority: 0.7
|
||||
changefreq: 'weekly'
|
||||
tags:
|
||||
- 'guide'
|
||||
- 'textual-guide'
|
||||
- 'guide-sitemap'
|
||||
---
|
||||
|
||||

|
||||
|
||||
Data science is becoming more relevant as a field and profession by the day. Part of this constant change is the mind-blowing speed at which AI is evolving these days. Every day a new model is released, every week a new product is built around it, and every month OpenAI releases an earth-shattering change that pushes the field even further than before.
|
||||
|
||||
Data scientists sit at the core of that progress, but what does it take to master the profession?
|
||||
|
||||
Mastering the essential data scientist skills goes beyond just solving complex problems. It includes the ability to handle data workflows, build machine learning models, and interpret data trends effectively.
|
||||
|
||||
In this guide, we'll explore the top 10 skills that future data scientists must work on to shine brighter than the rest in 2025, setting a foundation for long-term success.
|
||||
|
||||
These are the data scientist skills covered in the article:
|
||||
|
||||
* Programming proficiency with **Python, R, and SQL**
|
||||
* Data manipulation and analysis, including **data wrangling** and **exploratory data analysis**
|
||||
* Mastery of **machine learning** and **AI techniques**
|
||||
* Strong statistical and **mathematical** **foundations**
|
||||
* Familiarity with **big data technologies**
|
||||
* Data engineering for infrastructure and **ETL pipelines**
|
||||
* Expertise in **data visualization** with tools like **Plotly** and **D3.js**
|
||||
* **Domain knowledge** for aligning data science projects with business goals
|
||||
* **Soft skills** for communication, collaboration, and creativity
|
||||
* **Feature engineering** and selection for **model optimization**.
|
||||
* Staying current with trends like **MLOps** and **Generative AI.**
|
||||
|
||||
## **Understanding Data Science**
|
||||
|
||||
[Data science](https://roadmap.sh/ai-data-scientist) is an interdisciplinary field that combines multiple disciplines to make sense of data and drive actionable insights. It integrates programming, statistical analysis, and domain knowledge to uncover patterns and trends in both structured and unstructured data. This powerful combination enables data professionals to solve a variety of challenges, such as:
|
||||
|
||||
* Building predictive models to forecast sales or identify customer churn.
|
||||
* Developing optimization techniques to streamline supply chains or allocate resources more effectively.
|
||||
* Leveraging automation and artificial intelligence to create personalized recommendations or detect fraudulent activity in massive datasets.
|
||||
|
||||
At its core, data science empowers organizations to turn raw data into actionable insights. By interpreting data effectively and applying statistical models, data scientists support data-driven decision-making, ensuring businesses maintain a competitive edge.
|
||||
|
||||
The data science field requires a unique mix of technical skills, analytical prowess, and creativity to handle the vast array of complex data sets encountered in real-world scenarios. In other words, being a data scientist is not for everyone.
|
||||
|
||||
**1\. Programming Proficiency**
|
||||
|
||||

|
||||
|
||||
Programming remains a cornerstone of the data science field, forming the foundation for nearly every task in data science projects. Mastery of programming languages like Python, R, and SQL is crucial for aspiring data scientists to handle data workflows effectively.
|
||||
|
||||
Python is the undisputed leader in data science, thanks to its extensive libraries and frameworks. Pandas, NumPy, and Scikit-learn are essential for tasks ranging from data wrangling and numerical analysis to building machine learning models. Deep learning tools such as TensorFlow and PyTorch make Python indispensable for tackling advanced challenges like developing artificial neural networks for image recognition and natural language processing (NLP).
|
||||
|
||||
R excels in statistical analysis and visualization. Its specialized libraries, like ggplot2 for data visualization and caret for machine learning models, make it a preferred choice for academics and data analysis tasks that require interpreting data trends and creating statistical models.
|
||||
|
||||
SQL is the backbone of database management, which is essential for extracting, querying, and preparing data from structured databases. A strong command of SQL allows data professionals to manage massive datasets efficiently and ensure smooth integration with analytical tools.
|
||||
|
||||
## **2\. Data Manipulation and Analysis**
|
||||
|
||||

|
||||
|
||||
The ability to manipulate and analyze data lies at the heart of data science skills. These tasks involve transforming raw data into a format suitable for analysis and extracting insights through statistical concepts and exploratory data analysis (EDA).
|
||||
|
||||
Data wrangling is a critical skill for cleaning and preparing raw data, addressing missing values, and reshaping complex data sets. For example, consider a dataset containing customer transaction records with incomplete information. Using tools like Pandas in Python, a data scientist can identify missing values, impute or drop them as appropriate, and restructure the data to focus on specific variables like transaction frequency or total purchase amounts. This process ensures the dataset is ready for meaningful analysis.
|
||||
|
||||
Tools like Pandas, PySpark, and Dask are invaluable for handling unstructured data or working with massive datasets efficiently. These tools allow data scientists to transform complex data sets into manageable and analyzable forms, which is foundational for building machine learning models or conducting advanced statistical analysis.
|
||||
|
||||
Performing exploratory data analysis allows data scientists to identify patterns, correlations, and anomalies within structured data. Visualization libraries like Matplotlib and Seaborn, combined with Python scripts, play a significant role in understanding data insights before building predictive models or statistical models.
|
||||
|
||||
**3\. Machine Learning and AI**
|
||||
|
||||

|
||||
|
||||
Machine learning is a driving force in the data science industry, enabling data-driven decisions across sectors and revolutionizing how organizations interpret data and make predictions. Mastering machine learning algorithms and frameworks are among the top data science skills for aspiring data scientists who wish to excel in analyzing data and creating impactful solutions.
|
||||
|
||||
Data scientists commonly tackle supervised learning tasks, such as predicting housing prices through regression models or identifying fraudulent transactions with classification algorithms. For example, using Scikit-learn, a data scientist can train a decision tree to categorize customer complaints into predefined categories for better issue resolution. Additionally, unsupervised techniques like clustering are applied in market segmentation to group customers based on purchasing patterns, helping businesses make data-driven decisions.
|
||||
|
||||
Deep learning represents the cutting edge of artificial intelligence, utilizing artificial neural networks to manage unstructured data and solve highly complex problems. Frameworks like TensorFlow and PyTorch are essential tools for developing advanced solutions, such as NLP models for chatbot interactions or generative AI for creating realistic images. These tools empower data scientists to push the boundaries of innovation and unlock actionable insights from vast and complex datasets.
|
||||
|
||||
## **4\. Statistical and Mathematical Foundations**
|
||||
|
||||

|
||||
|
||||
Statistical concepts and mathematical skills form the backbone of building robust data models and interpreting data insights. These foundational skills are indispensable for anyone aiming to succeed in the data science field.
|
||||
|
||||
Probability theory and hypothesis testing play a vital role in understanding uncertainty in data workflows. For instance, a data scientist might use hypothesis testing to evaluate whether a new marketing strategy leads to higher sales compared to the current approach, ensuring data-driven decision-making.
|
||||
|
||||
Linear algebra and calculus are crucial for developing and optimizing machine learning algorithms. Techniques like matrix decomposition and gradient descent are used to train neural networks and enhance their predictive accuracy. These mathematical tools are the engine behind many advanced algorithms, making them essential data scientist skills.
|
||||
|
||||
Advanced statistical analysis, including A/B testing and Bayesian inference, helps validate predictions and understand relationships within complex datasets. For example, A/B testing can determine which website design yields better user engagement, providing actionable insights to businesses.
|
||||
|
||||
## **5\. Big Data Technologies**
|
||||
|
||||

|
||||
|
||||
While big data skills are secondary for most data scientists, understanding big data technologies enhances their ability to handle massive datasets efficiently. Familiarity with tools like Apache Spark and Hadoop allows data scientists to process and analyze distributed data, which is especially important for projects involving millions of records. For example, Apache Spark can be used to calculate real-time metrics on user behavior across e-commerce platforms, enabling businesses to personalize experiences dynamically.
|
||||
|
||||
Cloud computing skills, including proficiency with platforms like AWS or GCP, are also valuable for deploying machine learning projects at scale. A data scientist working with GCP's BigQuery can query massive datasets in seconds, facilitating faster insights for time-sensitive decisions. These technologies, while not the core of a data scientist's responsibilities, are crucial for ensuring scalability and efficiency in data workflows.
|
||||
|
||||
## **6\. Data Engineering**
|
||||
|
||||

|
||||
|
||||
Data engineering complements data science by creating the infrastructure required to analyze data effectively. This skill set ensures that data flows seamlessly through pipelines, enabling analysis and decision-making.
|
||||
|
||||
Designing ETL (Extract, Transform, Load) pipelines is a critical part of data engineering. For instance, a data engineer might create a pipeline to collect raw sales data from multiple sources, transform it by standardizing formats and handling missing values, and load it into a database for further analysis. These workflows are the backbone of data preparation.
|
||||
|
||||
Using tools like Apache Airflow, those workflows can be streamlined, while managing real-time data streaming using Kafka ensures that real-time data—such as social media feeds or IoT sensor data—is processed without delay. For example, a Kafka pipeline could ingest weather data to update forecasts in real-time.
|
||||
|
||||
Finally, storing and querying complex data sets in cloud computing with tools like Snowflake or BigQuery allows data scientists to interact with massive datasets effortlessly.
|
||||
|
||||
These platforms support scalable storage and high-performance queries, enabling faster analysis and actionable insights.
|
||||
|
||||
## **7\. Data Visualization**
|
||||
|
||||

|
||||
|
||||
Data visualization is a cornerstone of the data science field, as it enables data professionals to present data and communicate findings effectively. While traditional tools like Tableau and Power BI are widely used, aspiring data scientists should prioritize programming-based tools like Plotly and D3.js for greater flexibility and customization.
|
||||
|
||||
For example, using Plotly, a data scientist can create an interactive dashboard to visualize customer purchase trends over time, allowing stakeholders to explore the data dynamically. Similarly, D3.js offers unparalleled control for designing custom visualizations, such as heatmaps or network graphs, that convey complex relationships in a visually compelling manner.
|
||||
|
||||
Applying storytelling techniques further enhances the impact of visualizations. By weaving data insights into a narrative, data scientists can ensure their findings resonate with stakeholders and drive actionable decisions. For instance, a well-crafted story supported by visuals can explain how seasonal demand patterns affect inventory management, bridging the gap between technical analysis and strategic planning.
|
||||
|
||||
## **8\. Business and Domain Knowledge**
|
||||
|
||||

|
||||
|
||||
Domain knowledge enhances the relevance of data science projects by aligning them with organizational goals and addressing unique industry-specific challenges. Understanding the context in which data is applied allows data professionals to make their analysis more impactful and actionable.
|
||||
|
||||
For example, in the finance industry, a data scientist with domain expertise can design predictive models that assess credit risk by analyzing complex data sets of customer transactions, income, and past credit behavior. These models enable financial institutions to make data-driven decisions about lending policies.
|
||||
|
||||
In healthcare, domain knowledge allows data scientists to interpret medical data effectively, such as identifying trends in patient outcomes based on treatment history. By leveraging data models tailored to clinical needs, data professionals can help improve patient care and operational efficiency in hospitals.
|
||||
|
||||
This alignment ensures that insights are not only technically robust but also directly applicable to solving real-world problems, making domain knowledge an indispensable skill for data professionals seeking to maximize their impact.
|
||||
|
||||
## **9\. Soft Skills**
|
||||
|
||||

|
||||
|
||||
Soft skills are as essential as technical skills in the data science field, bridging the gap between complex data analysis and practical implementation. These skills enhance a data scientist's ability to communicate findings, collaborate with diverse teams, and approach challenges with innovative solutions.
|
||||
|
||||
**Communication** is critical for translating data insights into actionable strategies. For example, a data scientist might present the results of an exploratory data analysis to marketing executives, breaking down statistical models into simple, actionable insights that drive campaign strategies. The ability to clearly interpret data ensures that stakeholders understand and trust the findings.
|
||||
|
||||
**Collaboration** is equally vital, as data science projects often involve cross-functional teams. For instance, a data scientist might work closely with software engineers to integrate machine learning models into a production environment or partner with domain experts to ensure that data-driven decisions align with business objectives. Effective teamwork ensures seamless data workflows and successful project outcomes.
|
||||
|
||||
**Creativity** allows data scientists to find innovative ways to address complex problems. A creative data scientist might devise a novel approach to handling unstructured data, such as using natural language processing (NLP) techniques to extract insights from customer reviews, providing actionable insights that improve product development.
|
||||
|
||||
These critical soft skills complement technical expertise, making data professionals indispensable contributors to their organizations.
|
||||
|
||||
## 10\. Feature engineering and selection for model optimization
|
||||
|
||||

|
||||
|
||||
For machine learning models to interpret and use any type of data, that data needs to be turned into features. And that is where feature engineering and selection comes into play. These are two critical steps in the data science workflow because they directly influence the performance and accuracy of the models. If you think about it, the better the model understands what data to focus on, the better it'll perform.
|
||||
|
||||
These processes involve creating, selecting, and transforming raw data into useful features loaded with meaning that help represent the underlying problem for the model.
|
||||
|
||||
For example, imagine building a model to predict house prices. Raw data might include information like the size of the house in square meters, the number of rooms, and the year it was built. Through feature engineering, a data scientist could create new features, such as "price per square meter" or "age of the house," which make the data more informative for the model. These features can highlight trends that a model might otherwise miss.
|
||||
|
||||
Feature selection, on the other hand, focuses on optimizing the use and dependency on features by identifying the most relevant ones and removing the redundant or irrelevant features. For example, let's consider a retail scenario where a model is predicting customer churn, here it might benefit from focusing on features like "purchase frequency" and "customer feedback sentiment", while ignoring less impactful ones like "the time of day purchases are made". This helps to avoid the model getting overwhelmed by noise, improving both its efficiency and accuracy.
|
||||
|
||||
If you're looking to improve your data science game, then focusing on feature engineering and selection can definitely have that effect.
|
||||
|
||||
## 11\. Staying Current
|
||||
|
||||

|
||||
|
||||
The data science field evolves at an unprecedented pace, driven by advancements in artificial intelligence, machine learning, and data technologies. Staying current with emerging trends is essential for maintaining a competitive edge and excelling in the industry.
|
||||
|
||||
Joining **data science communities**, such as forums or online groups, provides a platform for exchanging ideas, discussing challenges, and learning from peers. For instance, platforms like Kaggle or GitHub allow aspiring data scientists to collaborate on data science projects and gain exposure to real-world applications.
|
||||
|
||||
Attending **data science conferences** is another effective way to stay informed. Events like NeurIPS, Strata Data Conference, or PyData showcase cutting-edge research and practical case studies, offering insights into the latest advancements in machine learning models, big data technologies, and cloud computing tools.
|
||||
|
||||
Engaging in **open-source projects** not only sharpens technical skills but also helps data professionals contribute to the broader data science community. For example, contributing to an open-source MLOps framework might provide invaluable experience in deploying and monitoring machine learning pipelines.
|
||||
|
||||
Embracing trends like **MLOps** for operationalizing machine learning, **AutoML** for automating model selection, and **Generative AI** for creating synthetic data ensures that data scientists remain at the forefront of innovation. These emerging technologies are reshaping the data science field, making continuous learning a non-negotiable aspect of career growth.
|
||||
|
||||
**Summary**
|
||||
|
||||
Mastering these essential data scientist skills—from programming languages and machine learning skills to interpreting data insights and statistical models—will future-proof your [career path in data science](https://roadmap.sh/ai-data-scientist/career-path). These include the core skills of data manipulation, statistical analysis, and data visualization, all of which are central to the data science field.
|
||||
|
||||
In addition, while big data technologies and data engineering skills are not the central focus of a data scientist's role, they serve as valuable, data science-adjacent competencies. Familiarity with big data tools like Apache Spark and cloud computing platforms can enhance scalability and efficiency in handling massive datasets, while data engineering knowledge helps create robust pipelines to support analysis. By building expertise in these areas and maintaining adaptability, you can excel in this dynamic, data-driven industry.
|
||||
|
||||
Check out our [data science roadmap](https://roadmap.sh/ai-data-scientist) next to discover what your potential learning path could look like in this role.
|
||||
|
||||
@@ -1,313 +0,0 @@
|
||||
---
|
||||
title: 'Data Science Tools: Our Top 11 Recommendations for @currentYear@'
|
||||
description: 'Master your data science projects with our top 11 tools for 2025! Discover the best platforms for data analysis, visualization, and machine learning.'
|
||||
authorId: fernando
|
||||
excludedBySlug: '/ai-data-scientist/tools'
|
||||
seo:
|
||||
title: 'Data Science Tools: Our Top 11 Recommendations for @currentYear@'
|
||||
description: 'Master your data science projects with our top 11 tools for 2025! Discover the best platforms for data analysis, visualization, and machine learning.'
|
||||
ogImageUrl: 'https://assets.roadmap.sh/guest/data-science-tools-1a9w1.jpg'
|
||||
isNew: true
|
||||
type: 'textual'
|
||||
date: 2025-01-28
|
||||
sitemap:
|
||||
priority: 0.7
|
||||
changefreq: 'weekly'
|
||||
tags:
|
||||
- 'guide'
|
||||
- 'textual-guide'
|
||||
- 'guide-sitemap'
|
||||
---
|
||||
|
||||

|
||||
|
||||
In case you haven't noticed, the data science industry is constantly evolving, potentially even faster than the web industry (which says a lot\!).
|
||||
|
||||
And 2025 is shaping up to be another transformative year for tools and technologies. Whether you're exploring machine learning tools, predictive modeling, data management, or data visualization tools, there's an incredible array of software to enable [data scientists](https://roadmap.sh/ai-data-scientist) to analyze data efficiently, manage data effectively, and communicate insights.
|
||||
|
||||
In this article, we dive into the essential data science tools you need to know for 2025, complete with ratings and expert picks to help you navigate the options.
|
||||
|
||||
## What is Data Science?
|
||||
|
||||
Data science is an interdisciplinary field that combines mathematics, statistics, computer science, and domain expertise to extract meaningful insights from data. It involves collecting, cleaning, and analyzing large datasets to uncover patterns, trends, and actionable information. At its core, data science aims to solve complex problems through data-driven decision-making, using techniques such as machine learning, predictive modeling, and data visualization.
|
||||
|
||||
The data science process typically involves:
|
||||
|
||||
* **Data Collection**: Gathering data from various sources, such as databases, APIs, or real-time sensors.
|
||||
* **Data Preparation**: Cleaning and transforming raw data into a usable format for analysis.
|
||||
* **Exploratory Data Analysis (EDA):** Identifying trends, correlations, and outliers within the dataset.
|
||||
* **Modeling**: Using algorithms and statistical methods to make predictions or classify data.
|
||||
* **Interpretation and Communication**: Visualizing results and presenting insights to stakeholders in an understandable manner.
|
||||
|
||||
Data science plays a key role in various industries, including healthcare, finance, marketing, and technology, driving innovation and efficiency by leveraging the power of data.
|
||||
|
||||
## Criteria for Ratings
|
||||
|
||||
We rated each of the best data science tools on a 5-star scale based on:
|
||||
|
||||
* **Performance:** How efficiently the tool handles large and complex datasets. This includes speed, resource optimization, and reliability during computation.
|
||||
* **Scalability:** The ability to scale across big data and multiple datasets. Tools were evaluated on their capability to maintain performance as data sizes grow.
|
||||
* **Community and Ecosystem:** Availability of resources, support, and integrations. Tools with strong community support and extensive libraries received higher ratings.
|
||||
* **Learning Curve:** Ease of adoption for new and experienced users. Tools with clear documentation and intuitive interfaces were rated more favorably.
|
||||
|
||||
## Expert Recommendations
|
||||
|
||||
Picking the best tools for your project is never easy, and it's hard to make an objective decision if you don't have experience with any of them.
|
||||
|
||||
So to make your life a bit easier, here's my personal recommendation, you can take it or leave it, it's up to you, but at least you'll know where to start:
|
||||
|
||||
While each tool has its strengths, my favorite pick among them is **TensorFlow**. Its perfect scores in performance, scalability, and community support (you'll see them in a second in the table below), combined with its relatively moderate learning curve, make it an amazing choice for building advanced neural networks and developing predictive analytics systems. You can do so much with it, like image recognition, natural language processing, and recommendation systems cementing its position as the leading choice (and my personal choice) in 2025\.
|
||||
|
||||
Now, to help you understand and compare the rest of the tools from this guide, the table below summarizes their grades across key criteria: performance, scalability, community support, and learning curve. It also highlights the primary use cases for these tools.
|
||||
|
||||
| Tool | Performance | Scalability | Community | Learning Curve | Best For |
|
||||
| ----- | ----- | ----- | ----- | ----- | ----- |
|
||||
| TensorFlow | 5 | 5 | 5 | 4 | Advanced neural networks, predictive analytics |
|
||||
| Apache Spark | 5 | 5 | 5 | 3 | Distributed analytics, real-time streaming |
|
||||
| Jupyter Notebooks | 4 | 4 | 5 | 5 | Exploratory analysis, education |
|
||||
| Julia | 4 | 4 | 4 | 3 | Simulations, statistical modeling |
|
||||
| NumPy | 4 | 3 | 5 | 5 | Numerical arrays, preprocessing workflows |
|
||||
| Polars | 5 | 4 | 4 | 4 | Data preprocessing, ETL acceleration |
|
||||
| Apache Arrow | 5 | 5 | 4 | 3 | Interoperability, streaming analytics |
|
||||
| Streamlit | 4 | 4 | 5 | 5 | Interactive dashboards, rapid deployment |
|
||||
| DuckDB | 4 | 4 | 4 | 5 | SQL queries, lightweight warehousing |
|
||||
| dbt | 4 | 4 | 5 | 4 | SQL transformations, pipeline automation |
|
||||
| Matplotlib | 4 | 3 | 5 | 4 | Advanced visualizations, publication graphics |
|
||||
|
||||
Let's now deep dive into each of these tools to understand in more detail, why they're in this guide.
|
||||
|
||||
## Data science tools for ML & Deep learning tools
|
||||
|
||||
### TensorFlow
|
||||
|
||||

|
||||
|
||||
TensorFlow remains one of the top data science tools for deep learning models and machine learning applications. Developed by Google, this open-source platform excels in building neural networks, predictive analytics, and natural language processing models.
|
||||
|
||||
* **Performance (★★★★★):** TensorFlow achieves top marks here due to its use of GPU and TPU acceleration, which allows seamless handling of extremely large models. Its ability to train complex networks without compromising on speed solidifies its high-performance ranking.
|
||||
* **Scalability (★★★★★):** TensorFlow scales from single devices to distributed systems effortlessly, enabling use in both prototyping and full-scale production.
|
||||
* **Community and Ecosystem (★★★★★):** With an active developer community and comprehensive support, TensorFlow offers unmatched resources and third-party integrations.
|
||||
* **Learning Curve (★★★★):** While it offers immense power, mastering TensorFlow's advanced features requires time, making it slightly less accessible for beginners compared to simpler frameworks.
|
||||
|
||||
**Strengths:** TensorFlow is a powerhouse for performance and scalability in the world of machine learning. Its GPU and TPU acceleration allow users to train and deploy complex models faster than many competitors. The massive community ensures constant innovation, with frequent updates, robust third-party integrations, and an ever-growing library of resources. The inclusion of TensorFlow Lite and TensorFlow.js makes it versatile for both edge computing and web applications.
|
||||
|
||||
**Best For:** Developing advanced neural networks for image recognition, natural language processing pipelines, building recommendation systems, and creating robust predictive analytics tools for a wide array of industries.
|
||||
|
||||
**Used by:** Google itself uses TensorFlow extensively for tasks like search algorithms, image recognition, and natural language processing. Similarly, Amazon employs TensorFlow to power recommendation systems and optimize demand forecasting.
|
||||
|
||||
## Data science tools for big data processing
|
||||
|
||||
### Apache Spark
|
||||
|
||||

|
||||
|
||||
An Apache Software Foundation project, Apache Spark is a powerhouse for big data processing, enabling data scientists to perform batch processing and streaming data analysis. It supports a wide range of programming languages, including Python, Scala, and Java, and integrates well with other big data tools like Hadoop and Kafka.
|
||||
|
||||
* **Performance (★★★★★):** Spark excels in processing speed thanks to its in-memory computing capabilities, making it a leader in real-time and batch data processing.
|
||||
* **Scalability (★★★★★):** Designed for distributed systems, Spark handles petabytes of data with ease, maintaining efficiency across clusters.
|
||||
* **Community and Ecosystem (★★★★★):** Spark's widespread adoption and integration with tools like Kafka and Hadoop make it a staple for big data workflows.
|
||||
* **Learning Curve (★★★):** Beginners may find distributed computing concepts challenging, though excellent documentation helps mitigate this.
|
||||
|
||||
**Strengths:** Spark stands out for its lightning-fast processing speed and flexibility. Its in-memory computation ensures minimal delays during large-scale batch or streaming tasks. The compatibility with multiple programming languages and big data tools enhances its integration into diverse tech stacks.
|
||||
|
||||
**Best For:** Executing large-scale data analytics in distributed systems, real-time stream processing for IoT applications, running ETL pipelines, and data mining for insights in industries like finance and healthcare.
|
||||
|
||||
**Used by:** Apache Spark has been adopted by companies like Uber and Shopify. Uber uses Spark for real-time analytics and stream processing, enabling efficient ride-sharing logistics. Shopify relies on Spark to process large volumes of e-commerce data, supporting advanced analytics and business intelligence workflows.
|
||||
|
||||
## Exploratory & Collaborative tools
|
||||
|
||||
### Jupyter Notebooks
|
||||
|
||||

|
||||
|
||||
Jupyter Notebooks are an essential data science tool for creating interactive and shareable documents that combine code, visualizations, and narrative text. With support for over 40 programming languages, including Python, R, and Julia, Jupyter facilitates collaboration and exploratory data analysis.
|
||||
|
||||
* **Performance (★★★★):** Jupyter is designed for interactivity rather than computational intensity, which makes it highly effective for small to medium-scale projects but less suitable for high-performance tasks.
|
||||
* **Scalability (★★★★):** While Jupyter itself isn't designed for massive datasets, its compatibility with scalable backends like Apache Spark ensures it remains relevant for larger projects.
|
||||
* **Community and Ecosystem (★★★★★):** Jupyter's open-source nature and extensive community-driven extensions make it a powerhouse for versatility and support.
|
||||
* **Learning Curve (★★★★★):** Its simple and intuitive interface makes it one of the most accessible tools for beginners and professionals alike
|
||||
|
||||
**Strengths:** Jupyter's flexibility and ease of use make it indispensable for exploratory analysis and education. Its ability to integrate code, output, and explanatory text in a single interface fosters collaboration and transparency.
|
||||
|
||||
**Best For:** Creating educational tutorials, performing exploratory data analysis, prototyping machine learning models, and sharing reports that integrate code with rich visualizations.
|
||||
|
||||
**Used by:** Jupyter Notebooks have become a staple for exploratory analysis and collaboration. Delivery Hero uses Jupyter to enhance delivery logistics through data analysis and visualization, while Intuit leverages the tool to facilitate financial data analysis in collaborative projects.
|
||||
|
||||
## Data science tools for statistical computing
|
||||
|
||||
### Julia
|
||||
|
||||

|
||||
|
||||
Julia is an emerging open-source programming language tailored for statistical computing and data manipulation. It combines the performance of low-level languages like C with the simplicity of high-level languages like Python. Julia's strengths lie in its speed for numerical computation and its dynamic type system, making it highly suitable for big data applications and machine learning models. The Julia ecosystem is rapidly growing, offering libraries for data visualization, optimization, and deep learning.
|
||||
|
||||
* **Performance (★★★★):** Julia's design prioritizes speed for numerical and statistical computing, placing it ahead of many high-level languages in terms of raw performance.
|
||||
* **Scalability (★★★★):** With built-in support for parallel computing, Julia scales well for tasks requiring significant computational power, although its ecosystem is still catching up to Python's.
|
||||
* **Community and Ecosystem (★★★★):** Julia's growing community and the increasing availability of libraries make it a solid choice, though it's not yet as robust as more established ecosystems.
|
||||
* **Learning Curve (★★★):** Julia's unique syntax, while designed for simplicity, presents a learning barrier for those transitioning from other languages like Python or R.
|
||||
|
||||
**Strengths:** Julia's ability to execute complex numerical tasks at high speed positions it as a top contender in scientific computing. Its built-in support for parallelism allows it to scale efficiently, while its clear syntax lowers barriers for domain experts transitioning from MATLAB or R.
|
||||
|
||||
**Best For:** Performing advanced statistical analysis, numerical optimization, developing simulations in physics and finance, and implementing machine learning models for high-performance environments.
|
||||
|
||||
**Used by:** The high-performance capabilities of Julia make it a favorite for statistical computing in industries like finance. For example, Capital One uses Julia for risk analytics and modeling, and Aviva employs it to improve actuarial computations and financial modeling processes.
|
||||
|
||||
### NumPy
|
||||
|
||||

|
||||
|
||||
A foundational library in the Python ecosystem, NumPy provides powerful tools for managing data structures, numerical computations, and statistical analysis. It is widely used for data preparation, enabling operations on large multi-dimensional arrays and matrices.
|
||||
|
||||
* **Performance (★★★★):** NumPy's optimized C-based implementation allows it to handle numerical operations with high efficiency, but it relies on integration with other tools for larger or distributed workloads.
|
||||
* **Scalability (★★★):** As a single-machine library, NumPy is best suited for datasets that fit in memory, though it integrates well with scalable tools like Dask for extended use.
|
||||
* **Community and Ecosystem (★★★★★):** NumPy's foundational role in Python's data science ecosystem means extensive resources and near-universal compatibility.
|
||||
* **Learning Curve (★★★★★):** Its straightforward API and clear documentation make NumPy an essential and approachable tool for data preparation and numerical computing.
|
||||
|
||||
**Strengths:** NumPy's versatility and efficiency underpin its widespread adoption in the Python ecosystem. Its array manipulation capabilities—from slicing and reshaping to broadcasting—make it a cornerstone for numerical operations.
|
||||
|
||||
**Best For:** Handling numerical arrays for preprocessing, matrix algebra in physics and engineering, foundational operations for machine learning pipelines, and performing basic statistical analysis efficiently.
|
||||
|
||||
**Used by:** NumPy serves as the foundation for many Python-based workflows. Spotify uses NumPy for numerical computations within its recommendation algorithms, and Airbnb employs it to optimize pricing strategies and improve customer experience through data analysis.
|
||||
|
||||
## **Data science tools for data manipulation & preprocessing tools**
|
||||
|
||||
### Polars
|
||||
|
||||

|
||||
|
||||
Polars is a lightning-fast data processing & manipulation library that enables data scientists to handle complex datasets. Unlike traditional libraries, Polars is written in Rust, offering exceptional performance and low memory usage. Its DataFrame API is intuitive and supports multi-threaded operations, making it a strong choice for large-scale data preprocessing and manipulation tasks.
|
||||
|
||||
* **Performance** (★★★★★): Polars' Rust-based architecture ensures exceptional speed and memory efficiency, positioning it as a leading tool for high-performance data manipulation.
|
||||
* **Scalability** (★★★★): While optimized for larger datasets, its scalability is limited to environments supported by multi-threading rather than distributed systems.
|
||||
* **Community and Ecosystem** (★★★★): Though its ecosystem is still growing, Polars' strong integration with Python and intuitive API provide a solid foundation.
|
||||
* **Learning Curve** (★★★★): With a user-friendly interface inspired by Pandas, Polars is easy to adopt for those familiar with similar tools, though Rust concepts may pose challenges for some.
|
||||
|
||||
**Strengths:** Polars stands out due to its unparalleled speed, derived from its Rust-based architecture. Its ability to process data in parallel ensures efficiency even with large datasets, reducing bottlenecks in ETL pipelines. The intuitive API and support for lazy evaluation make it both user-friendly and powerful.
|
||||
|
||||
**Best For:** Processing complex datasets for data cleaning, reshaping large-scale tables, and accelerating ETL pipelines in environments requiring high-speed operations.
|
||||
|
||||
**Used by:** Polars is gaining traction for its exceptional speed in data preprocessing and ETL workflows. Zillow uses Polars for efficient data preprocessing in real estate market analysis, while Stripe adopts it to accelerate ETL processes for handling financial transaction data.
|
||||
|
||||
### Apache Arrow
|
||||
|
||||

|
||||
|
||||
Apache Arrow is revolutionizing how data is stored and transferred for big data applications. Its in-memory columnar format accelerates data processing and integration between multiple datasets and tools. Apache Arrow also acts as a bridge between various programming languages and frameworks, improving the interoperability of data science workflows.
|
||||
|
||||
* **Performance (★★★★★):** Apache Arrow's in-memory columnar format delivers unmatched speed for data processing and transfer between tools.
|
||||
* **Scalability (★★★★★):** Its design supports seamless scalability across distributed systems, making it ideal for large-scale workflows.
|
||||
* **Community and Ecosystem (★★★★):** Arrow's adoption by major data tools ensures growing support, though its standalone ecosystem remains limited compared to broader frameworks.
|
||||
* **Learning Curve (★★★):** Understanding columnar data formats and workflows may require extra effort for beginners but pays off in advanced scenarios.
|
||||
|
||||
**Strengths:** Apache Arrow's columnar format provides a significant boost in performance and compatibility. Its seamless interoperability between tools such as Pandas, Spark, and TensorFlow eliminates data transfer inefficiencies. The library also supports multi-language workflows, making it indispensable for teams leveraging diverse tech stacks.
|
||||
|
||||
**Best For:** Ensuring efficient interoperability between data tools, accelerating data lake operations, and supporting real-time data analytics in distributed systems.
|
||||
|
||||
**Used by:** Google BigQuery integrates Arrow to enhance data interchange and query performance, and AWS Athena relies on Arrow's in-memory format to facilitate faster query responses and real-time analytics.
|
||||
|
||||
## Data science tools for application development
|
||||
|
||||
### Streamlit
|
||||
|
||||

|
||||
|
||||
Streamlit is an open-source framework for creating custom data science applications and dashboards. It simplifies the process of building interactive apps by using Python scripts, making it accessible even for those with minimal web development experience. Streamlit's API enables rapid prototyping of machine learning tools and visualizations.
|
||||
|
||||
* **Performance (★★★★):** Optimized for real-time application development, Streamlit is fast for small to medium-scale projects.
|
||||
* **Scalability (★★★★):** Streamlit scales reasonably well but isn't designed for massive applications.
|
||||
* **Community and Ecosystem (★★★★★):** Its active community and constant updates ensure excellent support for users.
|
||||
* **Learning Curve (★★★★★):** With a simple API and Python-centric design, Streamlit is easy for both developers and non-developers.
|
||||
|
||||
**Strengths:** Streamlit's simplicity and speed make it ideal for crafting interactive dashboards with minimal effort. Its integration with popular Python libraries like Pandas and Matplotlib allows users to transform raw data into meaningful insights quickly.
|
||||
|
||||
**Best For:** Creating interactive dashboards for sharing machine learning predictions, visualizing complex datasets with minimal development effort, and rapidly deploying prototypes for stakeholder feedback.
|
||||
|
||||
**Used by:** Streamlit simplifies the creation of interactive dashboards and data applications. Companies like Snowflake use Streamlit to build client-facing data apps, while Octopus Energy employs it to create dashboards that visualize energy consumption data for their customers.
|
||||
|
||||
### DuckDB
|
||||
|
||||

|
||||
|
||||
DuckDB is an open-source analytics database that simplifies structured queries on raw data. Designed to operate within analytical workflows, it supports SQL-based queries without the need for a dedicated database server. Its efficient storage model makes it ideal for querying structured and unstructured data in ad hoc analysis scenarios, making it highly favored for lightweight data warehousing tasks.
|
||||
|
||||
* **Performance (★★★★):** DuckDB delivers impressive speeds for ad hoc analytics, optimized for single-machine workflows.
|
||||
* **Scalability (★★★★):** Suitable for lightweight to medium-scale tasks, DuckDB integrates well into Python and R environments.
|
||||
* **Community and Ecosystem (★★★★):** Growing adoption and strong SQL compatibility make it increasingly popular.
|
||||
* **Learning Curve (★★★★★):** Its SQL-based interface ensures a smooth learning experience for most users.
|
||||
|
||||
**Strengths:** DuckDB's efficiency and ease of use make it a go-to tool for analysts. Its ability to operate without infrastructure overhead allows rapid deployment, and its SQL compatibility ensures accessibility for non-programmers.
|
||||
|
||||
**Best For:** Running interactive SQL queries in development workflows, performing data warehousing tasks without infrastructure overhead, and integrating ad hoc analyses directly into Python-based projects.
|
||||
|
||||
**Used by:** DuckDB's lightweight and efficient SQL analytics have found applications in various industries. MotherDuck integrates DuckDB to enable fast, in-process analytical queries, and SeMI Technologies leverages DuckDB within its Weaviate platform for high-speed vector search analytics.
|
||||
|
||||
### dbt (Data Build Tool)
|
||||
|
||||

|
||||
|
||||
dbt is a development framework for transforming data in warehouses. It allows analysts and engineers to write modular SQL-based transformations and manage data workflows efficiently. With its focus on collaboration and version control, dbt has become an essential tool for teams working on data pipelines.
|
||||
|
||||
* **Performance (★★★★):** dbt's modular approach allows for efficient and scalable SQL transformations.
|
||||
* **Scalability (★★★★):** Designed for modern data warehouses, dbt handles increasing workloads effectively.
|
||||
* **Community and Ecosystem (★★★★★):** Its thriving community and vendor support make it indispensable for data pipeline management.
|
||||
* **Learning Curve (★★★★):** Familiarity with SQL simplifies adoption, though pipeline concepts may require additional learning.
|
||||
|
||||
**Strengths:** dbt's modularity and focus on collaboration streamline complex SQL transformations. Its integration with version control systems ensures reproducibility, while the ability to test and document transformations within the tool fosters better collaboration among data teams.
|
||||
|
||||
**Best For:** Automating SQL transformations for analytics, managing data warehouse workflows with version control, and creating reusable and modular pipelines for team collaboration.
|
||||
|
||||
**Used by:** dbt has become essential for transforming and managing data workflows. JetBlue uses dbt to optimize their data warehouse for improved analytics, and GitLab adopts it to transform raw data into actionable insights, streamlining their analytics operations.
|
||||
|
||||
## Data science tools for data visualization
|
||||
|
||||
### Matplotlib
|
||||
|
||||

|
||||
|
||||
Matplotlib is a widely used data visualization library in Python that allows users to create static, animated, and interactive visualizations. Known for its flexibility, Matplotlib supports detailed customization, making it suitable for complex visualizations required in data science projects.
|
||||
|
||||
* **Performance (★★★★):** Matplotlib handles visualization tasks efficiently for small to medium datasets but may lag with complex or large-scale rendering.
|
||||
* **Scalability (★★★):** Designed for single-threaded use, it integrates with scalable tools for extended capabilities.
|
||||
* **Community and Ecosystem (★★★★★):** A veteran library with vast resources and tutorials ensures comprehensive support.
|
||||
* **Learning Curve (★★★★):** Accessible for beginners, though mastering advanced features takes effort.
|
||||
|
||||
**Strengths:** Matplotlib's extensive customization options allow it to cater to diverse visualization needs, from simple plots to publication-grade graphics. Its compatibility with libraries like NumPy ensures seamless data integration, while the active community provides extensive tutorials and third-party tools. Despite being a veteran library, Matplotlib remains relevant by adapting to modern visualization demands.
|
||||
|
||||
**Best For:** Creating publication-quality figures, animating time-series data, developing exploratory charts, and embedding visualizations into data-driven applications.
|
||||
|
||||
**Used by:** NASA uses Matplotlib to plot and visualize space mission data, while CERN relies on it for visualizing complex results from particle physics experiments.
|
||||
|
||||
## How to Pick the Right Data Science Tool?
|
||||
|
||||
Choosing the right data science tool can be a daunting task given the vast array of options available. The best tool for your project will depend on several factors, which can be broadly categorized into the evaluation criteria and the context of your specific project.
|
||||
|
||||
### Importance of Evaluation Criteria
|
||||
|
||||
1. **Performance**: This determines how well the tool handles large and complex datasets. Tools that offer fast computation, reliable processing, and efficient use of resources are ideal for high-performance environments.
|
||||
2. **Scalability**: As data grows, the ability to maintain consistent performance is critical. Tools that scale across big data frameworks or distributed systems ensure longevity and adaptability.
|
||||
3. **Community and Ecosystem**: A strong community provides valuable resources such as tutorials, documentation, and support. An extensive ecosystem ensures compatibility with other tools and libraries, making integration seamless.
|
||||
4. **Learning Curve**: A tool's usability can make or break its adoption. Tools with intuitive interfaces and comprehensive documentation enable faster onboarding for teams with diverse expertise.
|
||||
|
||||
### Considering Project Context
|
||||
|
||||
While evaluation criteria provide a standardized way to compare tools, the context of your project ultimately determines the best fit. Key considerations include:
|
||||
|
||||
Tech Stack: The tools should integrate smoothly with your existing technologies and workflows.
|
||||
|
||||
Team Expertise: The skill levels and experience of your team play a significant role in adoption. A tool with a steep learning curve may not be ideal for a team of beginners.
|
||||
|
||||
Project Deadlines: Time constraints can affect the choice of tools. A tool with extensive setup requirements may not suit a project with tight deadlines.
|
||||
|
||||
Data Complexity and Size: The nature and volume of your data should align with the tool's capabilities.
|
||||
|
||||
By balancing these evaluation criteria with the unique needs of your project, you can ensure that the chosen tool maximizes efficiency and effectiveness while minimizing challenges.
|
||||
|
||||
## Final Thoughts
|
||||
|
||||
Data science is an exciting and ever-evolving field, and the tools we've explored here represent the state-of-the-art of innovation for 2025\. Each tool has its own strengths, from high performance and scalability to user-friendly interfaces and robust community support. Whether you're just starting out in data science or managing complex, large-scale projects, there's a tool out there that's just right for you.
|
||||
|
||||
However, choosing that tool isn't just about star ratings or feature lists—it's about finding what works best for your specific context.
|
||||
|
||||
And remember, data science is as much about the journey as it is about the results. Exploring new tools, learning from community resources, and iterating on your processes will make you a better data scientist and help your projects thrive.
|
||||
|
||||
Check out our [data scientist roadmap](https://roadmap.sh/ai-data-scientist) to get a full view of your potential journey ahead\!
|
||||
@@ -1,166 +0,0 @@
|
||||
---
|
||||
title: 'Data Science vs. Computer Science: Which Path to Choose'
|
||||
description: 'Data science or computer science? Learn the tools, roles, and paths in each field to decide which fits your strengths and career goals.'
|
||||
authorId: ekene
|
||||
excludedBySlug: '/ai-data-scientist/vs-computer-science'
|
||||
seo:
|
||||
title: 'Data Science vs. Computer Science: Which Path to Choose'
|
||||
description: 'Data science or computer science? Learn the tools, roles, and paths in each field to decide which fits your strengths and career goals.'
|
||||
ogImageUrl: 'https://assets.roadmap.sh/guest/data-science-vs-computer-science-rudoc.jpg'
|
||||
isNew: true
|
||||
type: 'textual'
|
||||
date: 2025-02-06
|
||||
sitemap:
|
||||
priority: 0.7
|
||||
changefreq: 'weekly'
|
||||
tags:
|
||||
- 'guide'
|
||||
- 'textual-guide'
|
||||
- 'guide-sitemap'
|
||||
---
|
||||
|
||||

|
||||
|
||||
If you love uncovering patterns in data and using those insights to solve real-world problems, [data science](https://roadmap.sh/ai-data-scientist) might be the right fit for you. On the other hand, if you're drawn to creating systems, writing code, and building the tools that power today's technology, [computer science](https://roadmap.sh/computer-science) could be your path.
|
||||
|
||||
From my experience working on projects in both fields, I've seen how they overlap and where they differ. As a data scientist, you'll focus on analyzing complex data using math, programming, and problem-solving skills. Your work might include building models to extract meaningful insights from data, enabling you to identify patterns, predict trends, detect fraud, or improve recommendations.
|
||||
|
||||
Computer science, in contrast, focuses on understanding how computing systems work. You'll write code, design algorithms, and develop programs to solve problems. You might create web applications and software tools or even dive into artificial intelligence and cybersecurity.
|
||||
|
||||
Although these fields overlap in areas like programming, they cater to different interests and career goals. In this guide, I'll walk you through what each field involves, the skills you need, and the opportunities they offer. By the end, you'll have the clarity to make an informed choice about your future based on which path suits you best.
|
||||
|
||||
## Data science vs. computer science: What are the key differences?
|
||||
|
||||
First, let's look at this table that summarizes the differences. Then, we'll discuss each one in more detail.
|
||||
|
||||
| Characteristics | Data science | Computer science |
|
||||
| ----------------------------- | -------------------------------------------------------------------------- | -------------------------------------------------------------------------- |
|
||||
| Primary focus | Extracting insights from data | Building computer systems to perform tasks |
|
||||
| Industries | Finance, healthcare, marketing, e-commerce | cybersecurity, gaming, education |
|
||||
| Career paths | Data analysts, data scientists, machine learning engineers, data engineers | Software engineers, computer scientists, cybersecurity analyst |
|
||||
| Key areas and specializations | Machine learning, data mining, data visualization, statistical analysis | Data structures, software development, artificial intelligence |
|
||||
| Tools and technologies | Python (Pandas, NumPy), R, SQL, TensorFlow | Python, Java, C++, JavaScript, Git, Vs code, databases (MySQL and MongoDB) |
|
||||
| Educational background | Mathematics, economics, computer science, data science, physics | computer science, mathematics, electrical engineering |
|
||||
|
||||
**Your primary focus**
|
||||
The big difference between data science and computer science is their primary focus. If you choose data science, your role will involve extracting insights and helpful information from datasets. You'll use different tools and techniques to interpret and analyze data. The aim is to help businesses make data-driven decisions. Netflix, for example, uses machine learning and data science to learn your viewing history. Data scientists then analyze data to predict what shows you'll like and suggest movies.
|
||||
|
||||
In contrast, if you choose computer science, you'll focus on building computer systems to perform tasks. You'll create tools that make computers, web apps, data analysis, etc, work better. For example, a company like Google uses computer science to create algorithms that make search engines work. Computer scientists then create software systems and algorithms that will give you accurate results when you search online.
|
||||
|
||||
**Your career path**
|
||||
Computer science and data science have very different career paths. As a data science professional, you'll use data to help make decisions and solve business problems. You'll work in various industries, like finance and healthcare, and take on roles such as:
|
||||
|
||||
- **Data analyst**: Collect and analyze data to help businesses make intelligent decisions. For example, as a data analyst in healthcare, you would use data analysis to know which treatments work best for a specific illness.
|
||||
- **Data scientists**: Build predictive models to predict outcomes. As a data scientist in finance, you'll use data analysis to forecast how the stock market might go.
|
||||
- **Data engineers**: Build and maintain data systems that enable data analysis.
|
||||
- **Machine learning engineer**: Design and build machine learning models to solve everyday problems. As a machine learning engineer at a robotic car company, you'll create models to spot people, roads, traffic lights, and other cars. You'll be responsible for designing machine learning algorithms to help the car make fast decisions.
|
||||
|
||||

|
||||
|
||||
In contrast, as a computer science professional, you'll build the tools data engineers use to get work done. You'll also work in different industries, such as cybersecurity and gaming, and take on roles like:
|
||||
|
||||
- **Software engineers**: Build and maintain software systems, including gaming platforms like Steam.
|
||||
- **Computer scientists:** Study computer systems' theoretical and practical aspects to create applications.
|
||||
- **Cybersecurity analyst**: Monitor and address possible security threats like data breaches.
|
||||
|
||||
**Your key areas** **of** **specialization**
|
||||
Data science focuses on machine learning, data mining, statistical analysis, and more**.** As a data scientist, you'll use these specializations to understand trends and make better decisions.
|
||||
|
||||
In contrast, computer science focuses on artificial intelligence, [data structures](https://roadmap.sh/datastructures-and-algorithms), and software development. As a computer scientist, you'll study these fields to create the tools that data scientists use.
|
||||
|
||||
**The** **tools and technologies** **you'll** **use**
|
||||
Choosing data science requires using different tools and technologies to manipulate data. These tools include machine learning libraries **(TensorFlow)** and languages like [**Python**](https://roadmap.sh/python) **and R**. Python libraries like Pandas will help you with data manipulation and NumPy for math calculations. As a data scientist, you'll also use big data technologies like Hadoop to work with huge amounts of data.
|
||||
|
||||
On the other hand, computer science focuses on software development. As a computer scientist, you'll use programming languages like [Python](https://roadmap.sh/python), [C++](https://roadmap.sh/cpp), and [JavaScript](https://roadmap.sh/javascript) to create different web applications. You'll also use tools like [React](https://roadmap.sh/react), [Git](https://roadmap.sh/git-github), databases **(MySQL and** [**MongoDB**](https://roadmap.sh/mongodb)**)**, and IDEs **(VS code)** to write and test codes.
|
||||
|
||||
## What education do you need for computer and data science careers?
|
||||
|
||||
Getting a computer science degree gives you a solid foundation for software development. It will help you understand computer science principles and how to code and solve issues. Examples of these principles include programming languages, data structures, and operating systems. As a computer science graduate, you'll have a strong foundation that will help you land various tech jobs.
|
||||
|
||||

|
||||
|
||||
Many universities offer specializations in data science within their computer science programs. Others treat data science as a separate program, recognizing it as a field in its own right. They teach you all about machine learning, data visualization, statistics, and more. These data science programs combine ideas from computer science, mathematics, and other fields. At the end of the program, you'll get a data science degree and the necessary skills to get a tech job.
|
||||
|
||||
Studying at a university is not the only way to get a data and computer science education. Many computer science students and aspiring data scientists attend boot camps and learn via certifications or online tutorials. For instance, you can find many [data science courses](https://roadmap.sh/ai-data-scientist) on [roadmap.sh](http://roadmap.sh) and learn at your own pace.
|
||||
|
||||
Learning this way is more flexible and can work with all kinds of schedules and ways of learning. For instance, you can juggle work and study at the same time, which is much harder to do when you study at a university. If you go for a traditional degree like a data science degree, you'll need to invest more time, but you'll get a broad education.
|
||||
|
||||
With these educational paths in mind, a common question arises: **D\*\***o you need a computer science degree to pursue a career in data science?\*\* The answer is a simple no.
|
||||
|
||||
A computer science degree is not always required for computer and data science positions. It can help you start your career in data science, for example, by giving you a solid programming foundation. However, you can study other fields like mathematics, physics, and economics and still be a successful data scientist. You can also go through boot camps and online tutorials on data analysis, machine learning, and data visualization to gain the necessary skills.
|
||||
|
||||
Also, having some practical skills and constant practicing will give you more experience. When practicing, work on personal and open-source projects and build your portfolio to increase your chances of getting a job. Create time to attend meetups and [join online communities](https://discord.com/invite/cJpEt5Qbwa) to chat with other professionals.
|
||||
|
||||
## What are the essential skills you'll need?
|
||||
|
||||
Computer science and data science have a broad range of specialized skill sets. Some of these skills are relevant in both fields, and others are unique.
|
||||
|
||||

|
||||
|
||||
Even though computer science and data science are not the same, they do have some skills in common. These shared skills make it easy to switch between the two fields. Yes, it's true; you can transition from computer to data science and vice versa. The following are some examples of these shared skills:
|
||||
|
||||
- **Programming skills**: Programming skills are a crucial common ground for both fields. Knowing how to code to solve problems as a computer or data scientist is important. The process involves learning programming languages like [Python](https://roadmap.sh/python), having a deep understanding of data structures, and more. It lets you do software development **(computer science)** or data manipulation **(data science)**. However, it is worth noting that some tasks, like data visualization, do not require coding.
|
||||
- **Solving problems:** As a computer or data scientist, it is important to be able to solve problems. This helps you to create software, fix errors, and understand data.
|
||||
- **Mathematics and statistics**: Knowledge of mathematics and statistics will help you to solve problems in both fields. Computer science uses math principles in areas like algorithms and data structures. They will help you as a computer scientist make fast and better software and solve coding issues. As a data scientist, you use statistics to analyze data and machine learning.
|
||||
|
||||
### What skills do you need for computer science?
|
||||
|
||||
- **Programming languages:** Computer scientists use programming languages to give instructions to computers**.** Knowing one or more of these programming languages **(JavaScript, Java, etc.)** will help you to be successful in this field.
|
||||
- **System architecture:** Knowledge of system architecture will help you build reliable computer systems**.**
|
||||
- **Software development methodologies:** Software methodologies help you to plan and manage software projects. These methodologies **(agile, scrum, etc.)** will help you collaborate better with others when creating software.
|
||||
|
||||
### What skills do you need for data science?
|
||||
|
||||
- **Machine learning techniques**: Machine learning techniques are important skills in data science. A deep understanding of machine learning techniques will help you build prediction models. Among the many examples of these techniques are clustering and decision trees. They allow computers to make predictions and recognize patterns without instructions from anyone.
|
||||
- **Data analytics:** To get into the data science field, you must know data analytics. It is the starting point for many data science tasks, e.g., building machine learning models. Data analytics allows you to understand data, find patterns, and draw conclusions.
|
||||
- **Data visualization techniques**: These help present data results in clear visual stories. As a data scientist, they allow you to show patterns that might be hard to see in raw numbers in pictures or graphs. You do this using tools like Tableau, Matplotlib, or Power BI. Some examples of these techniques include bar charts, histograms, and scatter plots.
|
||||
|
||||
## How to choose between data science and computer science
|
||||
|
||||
Let's get into the details to help you decide which field fits you best. Choosing between both fields involves understanding your strengths, interests, and the job market.
|
||||
|
||||

|
||||
|
||||
**Your strengths and educational background**
|
||||
The path you choose boils down to what you're into, what you're good at, and your educational background. Computer science might be a good fit if you're into how computers work and creating software systems. An academic background in computer science or engineering also makes you a good fit.
|
||||
|
||||
If you like finding hidden patterns in data and solving problems, then data science could be for you. You'll also be a good fit if you've studied mathematics, economics, or computer science.
|
||||
|
||||
**Earning potential and industry demand**
|
||||
Many people ask: **Which pays more, data science or computer science?** Well, both fields pay high salaries and are in high demand in the industry.
|
||||
|
||||
Data scientists are in high demand across various sectors, like healthcare and finance. [According to Indeed](https://www.indeed.com/career/data-scientist/salaries?from=top_sb), the average salary for a data scientist in the United States (USA) across all industries is **$123,141.**
|
||||
|
||||

|
||||
|
||||
Computer science professionals like software engineers and software developers are also in demand. [According to Indeed](https://www.indeed.com/career/computer-scientist/salaries?from=top_sb), computer scientists in the USA make around $121,452 a year on average.
|
||||
|
||||

|
||||
|
||||
How much money you earn can depend on where you live, your field, and your skills. roadmap.sh provides [computer](https://roadmap.sh/computer-science) and [data science](https://roadmap.sh/ai-data-scientist) resources to help you improve in both fields.
|
||||
|
||||
## FAQ: Data science or computer science?
|
||||
|
||||
The following are answers to common questions to help you start your career as a computer and data scientist.
|
||||
|
||||
|
||||
|
||||
**Is data science harder than computer science?**
|
||||
Data science and computer science are challenging fields in their different ways. So, it is difficult to say one field is harder than another. The difficulty level varies based on personal viewpoints, interests, and capabilities.
|
||||
|
||||
**Is data science still in demand in 2025?**
|
||||
Yes, data science is still in demand in 2025. [The US Bureau of Labor Statistics](https://www.bls.gov/ooh/math/data-scientists.htm#:~:text=in%20May%202023.-,Job%20Outlook,on%20average%2C%20over%20the%20decade.) predicts a 36% increase in data science jobs from 2023 to 2033.
|
||||
|
||||
**How long does it take to complete most computer science programs?**
|
||||
Computer science programs like a bachelor's degree often take four years to complete. Master's programs take one to three years, depending on your pace or the school. Bootcamps and online certifications, however, may take less time.
|
||||
|
||||
**Is data science more focused on mathematics or computer science?**
|
||||
Both fields are important parts of data science—you can't have one without the other! It uses statistics and mathematical concepts to analyze data and computer science for handling data and building models. The balance may vary depending on the specific role, project, or focus within data science.
|
||||
|
||||
## What Next?
|
||||
|
||||
Deciding between data science and computer science does not need to be a difficult task. Figure out what works best for you by thinking about what you like, what you're good at, and what you want to achieve.
|
||||
|
||||
Also, you don't have to limit yourself to just one field. Many people use data and computer science skills to solve problems daily. So, it is very normal to be good in both fields.
|
||||
|
||||
However, if you're a beginner, focus on improving at one before learning another. [roadmap.sh](http://roadmap.sh) provides roadmap guides for you to learn [computer](https://roadmap.sh/computer-science) and [data science](https://roadmap.sh/ai-data-scientist). Both roadmaps contain resources and everything you need to get started.
|
||||
@@ -1,174 +0,0 @@
|
||||
---
|
||||
title: 'Data Science vs. Data Analytics: Which is Right for You?'
|
||||
description: 'Data science vs. Data analytics? This guide breaks down roles, tools, and growth opportunities for aspiring data professionals.'
|
||||
authorId: william
|
||||
excludedBySlug: '/ai-data-scientist/vs-data-analytics'
|
||||
seo:
|
||||
title: 'Data Science vs. Data Analytics: Which is Right for You?'
|
||||
description: 'Data science vs. Data analytics? This guide breaks down roles, tools, and growth opportunities for aspiring data professionals.'
|
||||
ogImageUrl: 'https://assets.roadmap.sh/guest/data-science-vs-data-analytics-3ol7o.jpg'
|
||||
isNew: true
|
||||
type: 'textual'
|
||||
date: 2025-02-06
|
||||
sitemap:
|
||||
priority: 0.7
|
||||
changefreq: 'weekly'
|
||||
tags:
|
||||
- 'guide'
|
||||
- 'textual-guide'
|
||||
- 'guide-sitemap'
|
||||
---
|
||||
|
||||

|
||||
|
||||
If you enjoy spotting patterns, analyzing trends, and driving business strategies, a career in [data analytics](https://roadmap.sh/data-analyst) might be your ideal fit. On the other hand, if algorithms, coding, and diving into uncharted territory excite you, a career in [data science](https://roadmap.sh/ai-data-scientist) could be the better path.
|
||||
|
||||
As someone whose work spans both fields and involves managing data to solve business challenges, I've seen how both data science and analytics shape business success.
|
||||
|
||||
Businesses rely heavily on insights, whether streamlining operations, predicting future trends, or crafting innovative strategies. Both data analytics and data science are pivotal to this process, but they approach problems differently.
|
||||
|
||||
As a data analyst, you'll focus on making sense of data through trends, visualizations, and actionable insights. As a data scientist, you'll work on building predictive data models and solving complex problems using advanced machine learning techniques.
|
||||
|
||||
But the big question is: Which path aligns with your goals?
|
||||
|
||||
The answer lies in your interests, strengths, and career aspirations. In this guide, I'll take you through the key differences between data science and data analytics and show you how they complement each other. You'll learn which skills are needed in each role and what career paths and opportunities they offer. By the end, you'll clearly know which role fits you best and how to start building your future.
|
||||
|
||||
The table below summarizes the key differences between data science and data analytics.
|
||||
|
||||
| | **Data Science** | **Data Analytics** |
|
||||
|---------------------|----------------------------------------------------------------------------------------------------------------------------------------|---------------------------------------------------------------------------------------------------------------------------------------------------|
|
||||
| **Key Role** | Uses statistical analysis and computational methods to gain insights from complex, structured and unstructured data. | Analyzes data collected from different sources, generates insights, and makes smart data-driven decisions. |
|
||||
| **Skills** | Machine learning, reinforcement learning techniques, data wrangling, big data technologies, cloud computing, and predictive analytics. | Proficient in data collection, SQL, knowledge of advanced Excel functions, data visualization, critical thinking, and create visual presentations. |
|
||||
| **Tools** | TensorFlow, PyTorch, Jupyter Notebooks, and GitHub/Git. | SQL, Excel, Tableau, Power BI, OpenRefine or Google Analytics |
|
||||
| **Career Paths** | Data Scientist > Machine Learning Engineer > AI Specialist | Data Analyst > Business Intelligence Manager > Chief Data Officer (CDO) |
|
||||
| **Salary Range** | For data scientist job positions, salary ranges from $119,040 to $158,747 per year. | For data analysis job positions, salary ranges from $82,000 to $86,200 per year. |
|
||||
|
||||
## What are data science and data analytics?
|
||||
|
||||
Data science and data analytics are two multidisciplinary fields that share the goal of helping organizations make smarter decisions, but they achieve this in different ways.
|
||||
|
||||
Data science uses advanced tools like machine learning and AI to extract insights from large, complex data sets. As a data scientist, your role is to uncover patterns and build predictive models that solve problems like fraud detection, ad optimization, and trend forecasting. Tools like [Python](https://roadmap.sh/python), Apache Spark, and [SQL](https://roadmap.sh/sql) are key to this work.
|
||||
|
||||
Data analytics, meanwhile, focuses on interpreting existing data to uncover trends and deliver actionable insights. As a data analyst, you'll use data analytics tools like Excel, Tableau, and Power BI to identify patterns, forecast sales, analyze customer behavior, and guide strategy. This work is grounded in understanding what has already happened to influence future business decisions.
|
||||
|
||||
By understanding the distinct purposes of these roles, we can examine how they interact to drive meaningful results.
|
||||
|
||||
## How do data science and data analytics complement each other?
|
||||
|
||||
For example, consider an ecommerce business whose sales have declined over the past quarter. A data analyst would start by examining historical sales data using tools like Excel or SQL to identify patterns and uncover potential causes, such as price changes or shifting customer demographics. These findings would then inform the data science team.
|
||||
|
||||
The data scientists would take this further by building predictive models to analyze future sales trends. They might incorporate additional features, like customer feedback or competitor pricing, to provide proactive recommendations that could reverse the decline, such as adjusting pricing strategies or launching targeted campaigns.
|
||||
|
||||
Therefore, data analytics helps you answer the "**what**,** why**, and **where**" questions. For example, you can use it to ask, "what caused past sales?" or "why did customer churn go up in Q1?" or "where is our main revenue coming from?" By looking at historical data, data analytics gives you the answers you need to improve and build better strategies.
|
||||
|
||||
The data science process takes it a step further by answering the "**why**" and **"how**" questions, like why sales went down and how to fix it. Data science leverages machine learning algorithms and predictive techniques to provide you with the right solutions to move forward.
|
||||
|
||||
Next, explore the specific job roles and responsibilities in data science and data analytics.
|
||||
|
||||
## **Data science vs. data analytics:** **Job role and responsibilities**
|
||||
|
||||
Here are the primary responsibilities that define the role of a data analyst and how they contribute to enabling data-informed business decisions.
|
||||
|
||||

|
||||
|
||||
**Key responsibilities of data scientist**
|
||||
As a data scientist, you'll work on complex tasks, such as building models, designing algorithms, and experimenting with data to uncover unknown outcomes. For example, to predict which customers are likely to cancel their subscriptions, you will analyze past customer behavior using predictive models to identify patterns.
|
||||
|
||||
Here is a quick overview of your key responsibilities as a data scientist:
|
||||
|
||||
- **Data collection and management:** Collect data from many sources, often dealing with structured and unstructured data. Your focus will be on getting the data for analysis, which can be simple to very complex, depending on the problem.
|
||||
- **Build predictive models:** Apply machine learning techniques to predict future behaviors, such as customer churn or sales demand.
|
||||
- **Design algorithms:** Develop new algorithms to optimize business operations, such as fraud detection systems or creating personalized recommendations for customers.
|
||||
- **Data experimentation:** Identify hidden patterns and extract meaningful insights from large and unstructured data sets.
|
||||
|
||||
**Key responsibilities of data analyst**
|
||||
As a data analyst, you focus on understanding structured data to answer specific business queries and make smart decisions. For example, to identify sales trends over the past year, you will perform the following tasks:
|
||||
|
||||
- **Data collection and processing:** Gather information from different sources and remove inaccuracies or unnecessary data. Use data-cleaning method to maintain accuracy and prepare data for analysis.
|
||||
- **Data analysis:** Interpret formatted and cleaned data using statistical tools and advanced modeling techniques.
|
||||
- **Data reporting:** Create clear and concise reports to share with business.
|
||||
- **Business recommendations:** Provide recommendations based on what you found to improve sales, efficiency, and performance.
|
||||
|
||||
Let's dig into the tools and skills needed for your selected job role.
|
||||
|
||||
## **Data science vs. data analytics: Skills and** **tools**
|
||||
|
||||
When you choose between becoming a data analyst or a data scientist, understanding the essential skills and tools for each role is crucial. Both positions demand analytical proficiency, but their technical requirements and focus areas differ significantly.
|
||||
|
||||
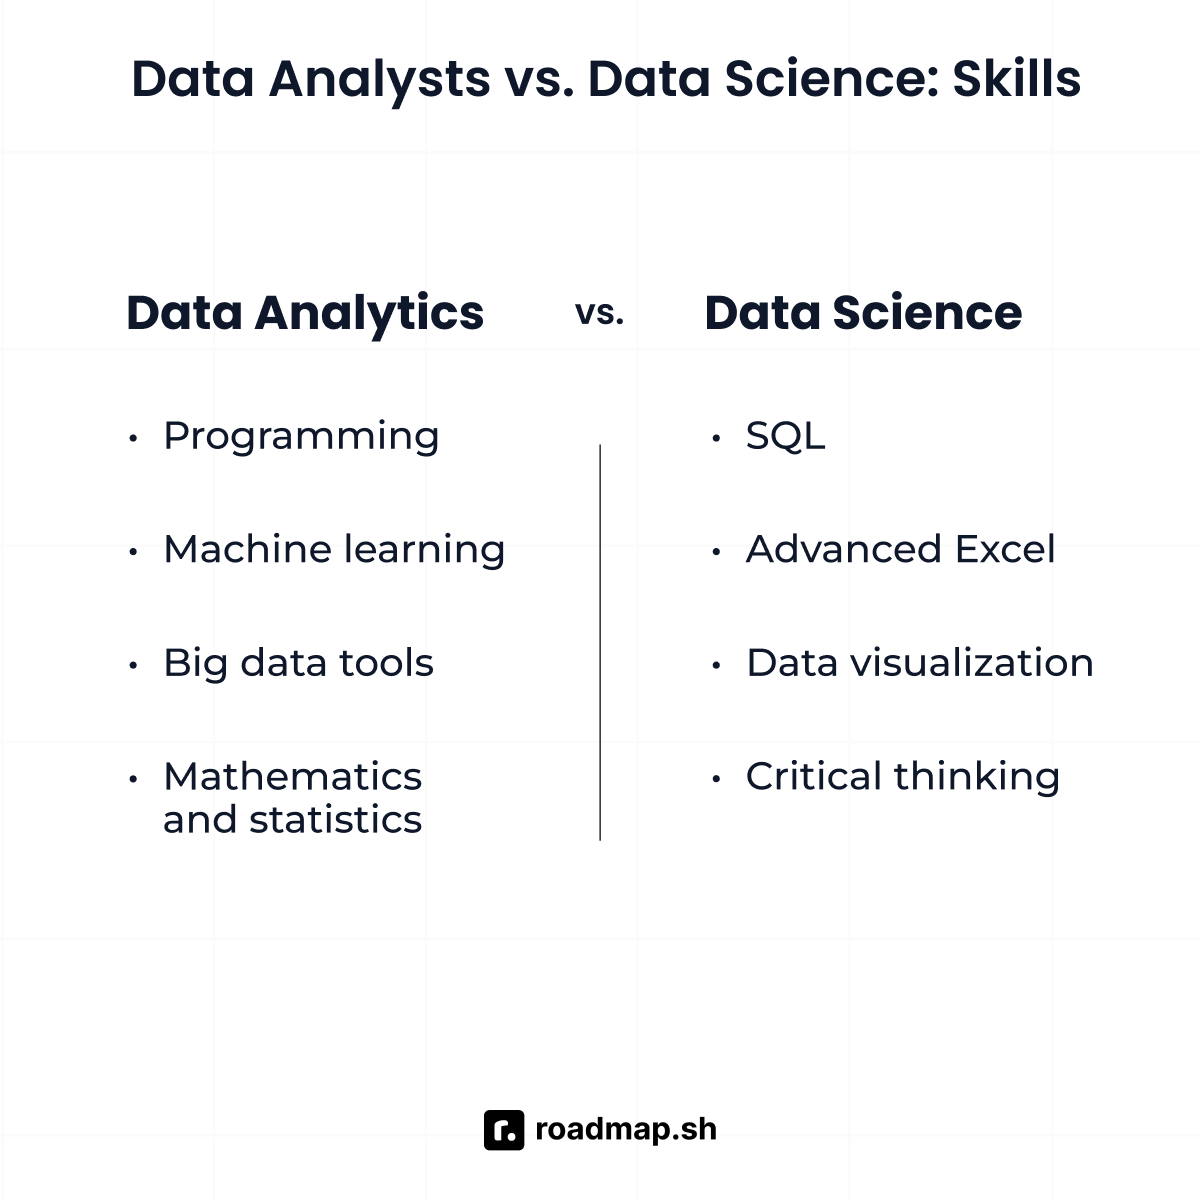
|
||||
|
||||
Let's explore the key skills and tools to help you make the right decision.
|
||||
|
||||
**Data scientist skills and tools**
|
||||
As a data scientist, you'll have technical, analytical, and problem-solving skills to handle large and complex datasets. Some of the main skills and tools that interviewers look for are:
|
||||
|
||||
- **Programming skills:** Mastery of Python and R is essential for data science tasks, including statistical analysis and machine learning model development.
|
||||
- **Machine learning expertise:** Knowledge of supervision and reinforcement learning techniques. Additionally, you should have an understanding of algorithms and clustering methods.
|
||||
- **Big data tools:** Hadoop and Apache Spark are a must for distributed storage and big data analysis.
|
||||
- **Mathematics and statistics**: Advanced knowledge of mathematics and statistics is essential for building models and deriving insights.
|
||||
|
||||
You should also focus on mastering tools like [TensorFlow](https://roadmap.sh/cpp/libraries/tensorflow), PyTorch, Jupyter Notebooks, [GitHub/Git](https://roadmap.sh/git-github), SQL, Apache Spark, Hadoop, [Docker](https://roadmap.sh/docker), [Kubernetes](https://roadmap.sh/kubernetes), and Tableau. Data visualization, Scikit-learn, and version control systems are also important for data science.
|
||||
|
||||
**Data analyst skills and tools**
|
||||
As a data analyst, your role focuses on data interpretation for business decisions. Some of the main skills and tool proficiencies you'll need to excel in this role are:
|
||||
|
||||
- **SQL (Structured Query Language):** Knowledge of SQL is necessary for querying, managing and retrieving data from databases.
|
||||
- **Advanced Excel skills:** Strong Excel skills, including pivot tables, VLOOKUP, and data analysis functions, are necessary to organize and analyze data.
|
||||
- **Data visualization:** Ability to create good-looking charts and dashboards using tools like Tableau and Power BI is a must for presenting insights in a clear and effective way.
|
||||
- **Critical thinking:** Strong analytical and critical thinking skills to identify trends and derive meaning from data.
|
||||
|
||||
Check out the [Data Scientist](https://roadmap.sh/ai-data-scientist) and [Data Analyst](https://roadmap.sh/data-analyst) roadmaps for a structured approach. These will help you decide what to learn and where to focus. By following them, you can prioritize what to learn, focus on high-demand areas, and not feel overwhelmed. Also, join local or online meetups to connect with professionals and participate in hackathons to get hands-on experience and add to your portfolio.
|
||||
|
||||
Let's move forward to understand different career trajectories that fall under data science and data analysis. Also, check out the salary ranges for each job profile.
|
||||
|
||||
## **Data science vs. data analytics: Career paths and salary insights**
|
||||
|
||||
If you're looking into data science or data analytics careers, you're entering a field with huge growth. Both have their own focus, but there's a lot of overlap in skills, tools, and methodologies, so it's easier to move between roles or expand your skills across both domains.
|
||||
|
||||

|
||||
|
||||
Here is a quick overview of role transitions, salary ranges, and the steps you can take to advance your career as a data scientist and data analyst.
|
||||
|
||||
**Data science career paths and salary insights**
|
||||
As a data scientist engineer, these are the roles that are typically available to you throughout your career:
|
||||
|
||||
- Data scientist
|
||||
- Machine learning engineer
|
||||
- AI specialist
|
||||
|
||||
**Data scientist:** As a data scientist, you will analyze large datasets, develop predictive data models, and implement algorithms to extract insights. Additionally, you must have knowledge of machine learning basics, structured data, statistical modeling, and communication skills.
|
||||
|
||||
In 2024, the [average salary](https://www.datacamp.com/blog/data-science-salaries) for a data scientist is $123,069 per year in the United States.
|
||||
|
||||
**Machine learning engineer:** In this role, you'll focus on developing and deploying machine learning models in production environments. This role requires technical expertise in software engineering, computer science, big data technologies, and scalable systems. You must have knowledge of advanced machine learning, computer science, cloud computing, and software development lifecycle (SDLC) knowledge.
|
||||
|
||||
According to [Indeed](https://www.indeed.com/career/machine-learning-engineer/salaries), the average salary for a machine learning engineer in the United States is $161,715 per year.
|
||||
|
||||
**AI specialist:** You'll focus on designing cutting-edge AI solutions, managing teams of data professionals, and driving strategic artificial intelligence initiatives for organizations. You even perform research on emerging spot trends and implement AI frameworks.
|
||||
|
||||
According to [Glassdoor,](https://www.glassdoor.co.in/Salaries/us-ai-specialist-salary-SRCH_IL.0,2_IN1_KO3,16.htm) the estimated salary of an AI specialist job profile in the US is $129,337 per year, with an average salary of $105,981 per year.
|
||||
|
||||
**Data analytics career paths and salary insights**
|
||||
If you're leaning towards data analytics, here are some common job titles for you, along with salary details for each role:
|
||||
|
||||
- Data analyst
|
||||
- Business intelligence manager
|
||||
- Chief data officer
|
||||
|
||||
**Data analyst:** This role involves collecting, cleaning, and analyzing data to generate actionable insights. You'll work on dashboards, reporting, and descriptive analytics using tools like Excel and Tableau. Additionally, you must have basic programming knowledge, data visualization, and data mining skills.
|
||||
|
||||
In 2024, the estimated [average salary](https://www.indeed.com/career/data-analyst/salaries) of a data analyst ranges around $80,811 per year depending on experience, location, and specific skills in demand.
|
||||
|
||||
**Business intelligence manager:** As a business intelligence manager, you'll lead data reporting and visualization strategies, manage data accuracy, and design scalable solutions. Communication skills and proficiency in business intelligence tools are key to this role.
|
||||
|
||||
[ZipRecruiter](https://www.ziprecruiter.com/Salaries/Business-Intelligence-Manager-Salary) reported that the salary of a business intelligence manager in the US ranges from $29,500 to $158,500.
|
||||
|
||||
**Chief data officer (CDO):** Responsible for an organization's data strategy, data governance, and data leveraging for competitive advantage. For this job role, you must have the necessary skills, such as data governance, data strategy, data engineering, and management of complex architecture.
|
||||
|
||||
In 2024, the estimated total pay for a chief [data officer](https://www.glassdoor.co.in/Salaries/us-chief-data-officer-salary-SRCH_IL.0,2_IN1_KO3,21.htm) is $373,952 per year in the US.
|
||||
|
||||
## **What** **Next**
|
||||
|
||||
Once you've decided to pursue a career in data science or data analytics, the next step is figuring out where to start. Our [AI-Data Scientist](https://roadmap.sh/ai-data-scientist) and [Data Analyst roadmap](https://roadmap.sh/data-analyst) are designed to help you with that by breaking down the skills, tools and concepts into smaller steps. Whether you are drawn to the complexity of algorithms or analyzing trends, both paths offer rewarding opportunities for personal and professional growth, these roadmaps will give you a clear structure to build a solid foundation and move forward with confidence.
|
||||
|
||||
Remember, the key to success in both fields is a commitment to continuous learning. For detailed overview of any specific role, join the [Discord community](https://roadmap.sh/discord) and stay informed!
|
||||
@@ -1,181 +0,0 @@
|
||||
---
|
||||
title: 'Data Science vs Machine Learning: How are they different?'
|
||||
description: 'Excited about a career in data science or machine learning? Learn the differences, key skills, tools, and how to choose the role that aligns with your ambitions'
|
||||
authorId: ekene
|
||||
excludedBySlug: '/ai-data-scientist/vs-machine-learning'
|
||||
seo:
|
||||
title: 'Data Science vs Machine Learning: How are they different?'
|
||||
description: 'Excited about a career in data science or machine learning? Learn the differences, key skills, tools, and how to choose the role that aligns with your ambitions.'
|
||||
ogImageUrl: 'https://assets.roadmap.sh/guest/data-science-vs-machine-learning-gaa7s.jpg'
|
||||
isNew: true
|
||||
type: 'textual'
|
||||
date: 2025-02-06
|
||||
sitemap:
|
||||
priority: 0.7
|
||||
changefreq: 'weekly'
|
||||
tags:
|
||||
- 'guide'
|
||||
- 'textual-guide'
|
||||
- 'guide-sitemap'
|
||||
---
|
||||
|
||||

|
||||
|
||||
If you're excited by the idea of extracting insights from data to guide decisions, a career in [data science](https://roadmap.sh/ai-data-scientist) might be for you. On the other hand, if you're drawn to creating the algorithms behind AI systems and building intelligent applications, machine learning could be your ideal path.
|
||||
|
||||
Both fields are at the forefront of innovation, driving transformative technologies like ChatGPT, DALL-E, and Gemini. These advancements, used across industries like healthcare, finance, and tech, owe their success to the growing collaboration between data science and machine learning. As AI becomes more accessible with tools from companies like OpenAI and AWS, the demand for experts in these fields is only increasing.
|
||||
|
||||
So, how do you choose between these high-demand, rewarding careers? As an ML Engineer with experience on projects that span across data science and machine learning, I have gained a deep understanding of the overlaps and differences between these fields. In this guide, I will explain the responsibilities of each role, highlight their key differences, and outline the essential skills for success. By the end, you'll be better equipped to pick the path that matches your interests, strengths, and career goals.
|
||||
|
||||
The table below summarizes the key differences between data science and machine learning you should consider to help you evaluate which one best fits your career goals:
|
||||
|
||||
| **Aspect** | **Data science** | **Machine learning** |
|
||||
| ------------------------------------- | ----------------------------------------------------------------------------------------------- | -------------------------------------------------------------------------------------------------- |
|
||||
| **Ideal for you** **i\*\***f\***\*…** | You enjoy exploring and analyzing data to extract insights and inform decisions. | You are passionate about creating algorithms and systems that learn and improve automatically. |
|
||||
| **Educational background** | Strong foundation in statistics, data analysis, and visualization tools. | Strong foundation in mathematics, programming, and AI techniques. |
|
||||
| **Career opportunities** | Data scientist, [Data Analyst](https://roadmap.sh/data-analyst), Business Intelligence Analyst. | Machine learning Engineer, AI Researcher, Deep Learning Specialist. |
|
||||
| **Industries** | Healthcare, finance, marketing, e-commerce, and government sectors. | Technology, autonomous systems, robotics, fintech, and R&D labs. |
|
||||
| **Skills you'll need** | Data cleaning, exploratory analysis, storytelling, and domain expertise. | Proficiency in machine learning libraries, algorithm design, and optimization. |
|
||||
| **Growth potential** | Strong demand across industries as companies seek to become more data-driven. | High demand in tech-driven fields as AI adoption accelerates. |
|
||||
| **Creativity vs. technical** | Balances creativity in visualizations with technical skills in data processing. | Heavily focused on technical and mathematical skills for problem-solving and predictive analytics. |
|
||||
| **Long-term vision** | Perfect if you want to lead data-driven strategy or explore business analytics. | Ideal if you aim to innovate in AI, robotics, or advanced tech solutions. |
|
||||
|
||||
Before looking at these features in detail, let's take a closer look at these two fields.
|
||||
|
||||
## What is data science?
|
||||
|
||||
Data science is a field that combines techniques from statistics, domain knowledge, computer science, and data analysis to gain insights from structured and unstructured data. As a data scientist, you'll use tools, machine learning models, and algorithms to understand data and drive decision-making. You'll use these insights to help businesses increase profits, create innovative products and services, improve systems, and solve problems across various industries.
|
||||
|
||||
**Key Components of Data Science**
|
||||
The key components of data science involve the following processes:
|
||||
|
||||

|
||||
|
||||
1. **Data collection**: The first step is to gather raw data from various sources such as APIs, sensors, databases, and web scraping.
|
||||
2. **Data cleaning and preparation**: After collecting the raw data, it must be cleaned by removing inaccuracies, handling missing values, and formatting it for analysis.
|
||||
3. **Exploratory Data Analysis (EDA)**: Use statistical methods and visualization techniques to explore the data, identify trends, patterns, and anomalies, and gain a better understanding of the dataset.
|
||||
4. **Data modeling and machine learning**: Apply machine learning algorithms to build models that can identify patterns, predict outcomes, and automate processes.
|
||||
5. **Data visualization**: Use tools like charts, graphs, and dashboards to present insights and communicate findings clearly to stakeholders.
|
||||
6. **Deployment and monitoring**: Implement data models in real-world applications and continuously monitor their performance to ensure they remain accurate and effective.
|
||||
|
||||
### Essential Skills and Tools You Need for a Successful Data Science Career
|
||||
|
||||
To build a successful career in data science, knowledge of a programming language like [Python](https://roadmap.sh/python) is essential. Beyond that, as a data scientist, you'll need to develop expertise in the following skills and tools:
|
||||
|
||||
- **Programming languages**: You'll need proficiency in [SQL](https://roadmap.sh/sql), R, SAS, and others to collect, manipulate, and manage both structured and unstructured data.
|
||||
- **Mathematics, statistics, and probability**: A strong grasp of these concepts will enable you to build accurate models and make data-driven decisions with confidence.
|
||||
- **Data wrangling and visualization**: You'll be responsible for cleaning, transforming, and visualizing data using tools like Matplotlib, Seaborn, Power BI, and Tableau to present insights effectively.
|
||||
- **Machine learning and predictive modeling**: Knowledge of machine learning algorithms and techniques for building models that can make predictions and automate decision-making processes.
|
||||
- **Data analysis tools**: Familiarity with tools like Jupyter Notebooks, Pandas, NumPy, Apache Spark, and Scikit-learn will help you analyze and process data with ease.
|
||||
- **Cloud platforms**: Experience with cloud platforms such as [AWS](https://roadmap.sh/aws), Azure, and Google Cloud will enable you to leverage cloud resources for scalable computing and efficient model deployment.
|
||||
|
||||
## What is machine learning?
|
||||
|
||||
Machine learning is a branch of Artificial Intelligence (AI) that enables computers to learn from data and make predictions without being explicitly programmed. Rather than manually coding rules for every scenario, machine learning models learn from available data to perform tasks such as fraud detection, recommendation systems, natural language processing, and image recognition. It can be broadly categorized into the following types:
|
||||
|
||||

|
||||
|
||||
- **Supervised learning**: In supervised learning, you train a model labeled data to predict outcomes and identify patterns. For example, you can use a dataset with details like location, square footage, and other factors to teach the model how to predict house prices.
|
||||
- **Unsupervised learning**: In unsupervised learning, the model is trained on unlabeled data and discovers patterns or groupings on its own. For example, you can use it to segment customers based on their purchasing habits without specifying predefined categories.
|
||||
- **Reinforcement learning**: In reinforcement learning, you train a model through a trial-and-error process to achieve the best outcomes. For instance, self-driving cars use reinforcement learning by continuously learning to recognize obstacles, road signs, and blockages through repeated experiences.
|
||||
|
||||
### Key Components of Machine Learning
|
||||
|
||||
The key components of machine learning involve the following processes:
|
||||
|
||||
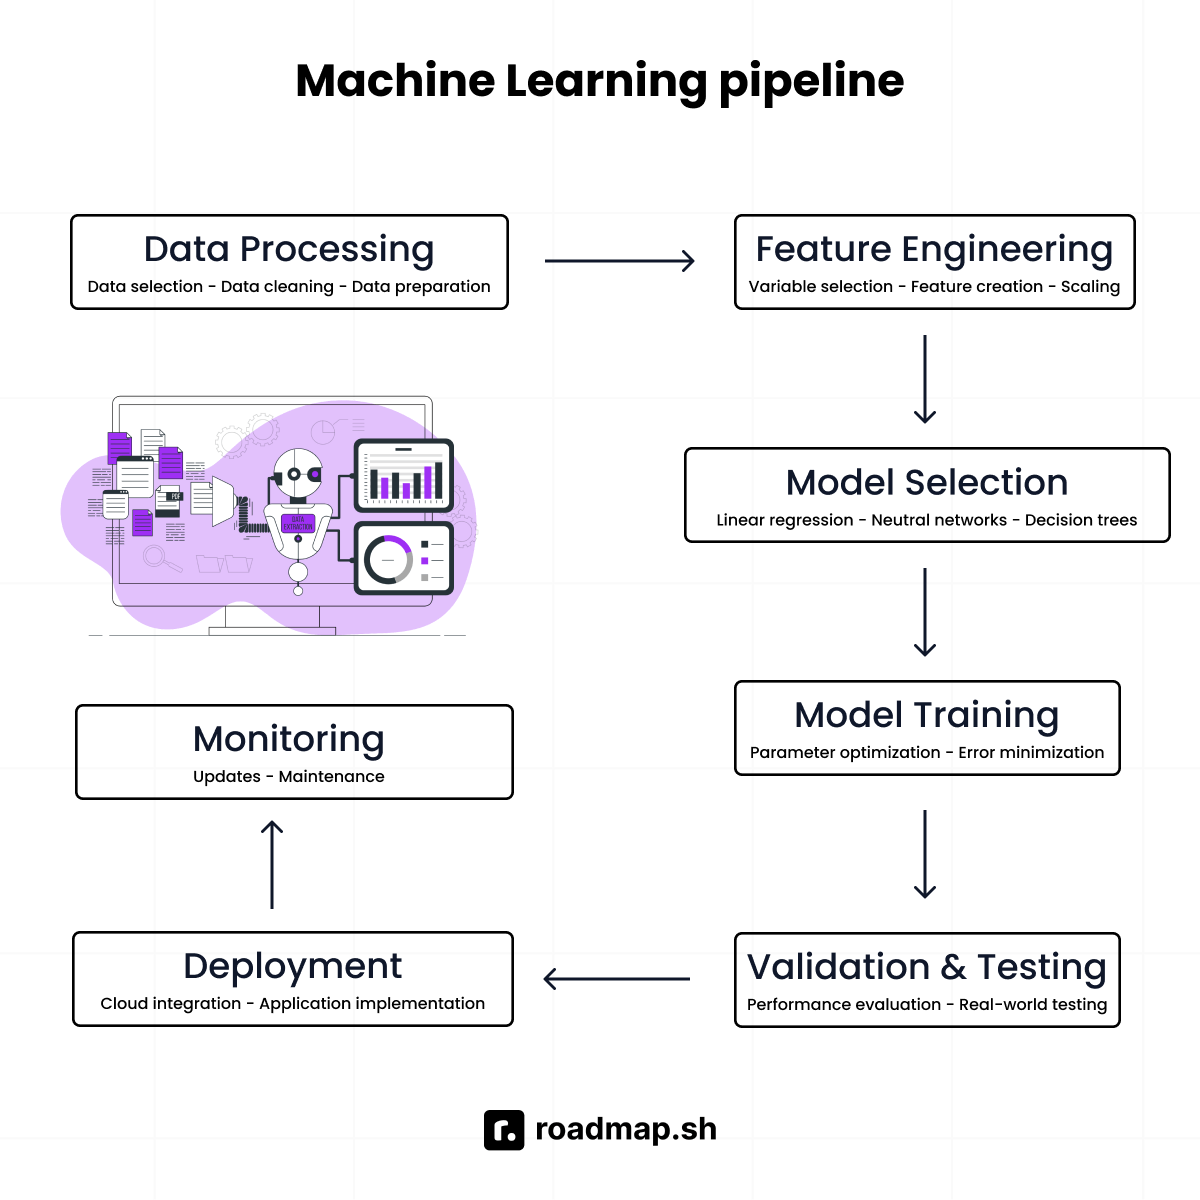
|
||||
|
||||
1. **Data processing**: The foundation of any machine learning system is data. For the model to work effectively, it requires selecting and preparing the right data for training.
|
||||
2. **Feature engineering**: This step involves selecting the right variables (features) that the model can use to make accurate predictions. For example, a housing price prediction model would need features like the number of bedrooms, square footage, and location to make reliable predictions.
|
||||
3. **Model selection**: Choosing the appropriate model for a specific task is crucial. For instance, a **Linear Regression** model is suitable for predicting continuous values, while **Neural Networks** are better suited for tasks like image recognition.
|
||||
4. **Model training**: In this process, the selected model is fed with training data to help it learn patterns. The model's internal parameters are adjusted to minimize prediction errors.
|
||||
5. **Validation and testing**: After training, the model's performance is evaluated using a separate validation dataset. A final test dataset is used to ensure the model performs well in real-world scenarios.
|
||||
6. **Deployment**: Once the model is ready, it is integrated into real-world applications or deployed on cloud platforms to be accessed by third party users.
|
||||
7. **Model monitoring and maintenance**: After deployment, the model must be regularly monitored and updated to maintain accuracy and adapt to changes over time.
|
||||
|
||||
### Essential Skills and Tools You Need for a Successful Machine Learning Career
|
||||
|
||||
To build a successful career in machine learning, you'll need to develop the following essential skills and become familiar with key tools:
|
||||
|
||||
- **Strong understanding of mathematics and statistics**: You'll need a solid understanding of linear algebra, calculus, probability, and statistics to grasp how machine learning algorithms function.
|
||||
- **Proficiency in programming languages**: Python and R are must-haves for implementing machine learning models and handling data efficiently.
|
||||
- **Data handling and preprocessing skills**: You need a solid understanding of how to clean, preprocess, and transform raw data into a format suitable for training models.
|
||||
- **Knowledge of machine learning algorithms**: Understanding algorithms like Linear Regression, Q-learning, and K-means and knowing when to apply them will help you tackle diverse challenges.
|
||||
- **Model evaluation and tuning**: You need to master techniques to evaluate model performance (e.g., accuracy, precision, recall) and fine-tune hyperparameters to improve results.
|
||||
- **Familiarity with libraries and frameworks**: Hands-on experience with Scikit-learn, TensorFlow, Keras, and other popular libraries and frameworks will help you build and deploy machine learning models efficiently.
|
||||
- **Cloud Platforms for Infrastructure**: Familiarity with cloud platforms like AWS, Google Cloud, and Azure will let you manage the infrastructure needed for large-scale machine learning projects.
|
||||
|
||||
While data science and machine learning share common skills, tools, and workflows, they differ significantly in their approaches, methodologies, and focus areas. The table below summarizes the key differences between machine learning and data science:
|
||||
|
||||
| **Category** | **Data science** | **Machine learning** |
|
||||
| ------------------------------ | ---------------------------------------------------------------------------------- | ------------------------------------------------------------------------------------------------------------------------ |
|
||||
| **Mathematics and statistics** | Strong knowledge of statistics, probability, and linear algebra. | Deep understanding of calculus, linear algebra, and optimization techniques. |
|
||||
| **Programming languages** | Python, R, and SQL for data manipulation, statistical analysis, and visualization. | Python, [C++](https://roadmap.sh/cpp), and [Java](https://roadmap.sh/java) for implementing machine learning algorithms. |
|
||||
| **Data handling** | Data wrangling, data cleaning, and data visualization. | Data preprocessing, feature engineering, and handling large datasets. |
|
||||
| **Machine learning basics** | Basic understanding of supervised, unsupervised learning, and regression. | Advanced knowledge of machine learning algorithms, including deep learning. |
|
||||
| **Business acumen** | Ability to translate business problems into data solutions. | Focus on technical problem-solving without a primary business context. |
|
||||
| **Tools and frameworks** | Tableau, Excel, Hadoop, Pandas, Matplotlib, and Scikit-learn. | TensorFlow, PyTorch, Scikit-learn, Keras, and XGBoost. |
|
||||
| **Data visualization** | Building dashboards, reports, and storytelling through data. | Creating visualizations primarily for model performance evaluation. |
|
||||
| **Communication skills** | Strong emphasis on presenting insights to non-technical stakeholders. | Less focus on communication; more technical documentation. |
|
||||
| **Problem-solving approach** | Emphasis on interpreting data to guide decisions. | Emphasis on building models to automate decision-making. |
|
||||
| **Domain knowledge** | Domain expertise in industries like healthcare, finance, marketing, etc. | Less reliance on specific domain knowledge; more generalizable algorithms. |
|
||||
| **Software engineering** | Less focus on software engineering practices. | Strong focus on scalable system design and code optimization. |
|
||||
| **Algorithm understanding** | Basic knowledge of algorithms for data analysis. | Deep understanding of algorithms, including neural networks and gradient descent. |
|
||||
|
||||
Now that we've covered data science and machine learning regarding processes, tools, similarities, and differences, let's explore the key points you should consider to make the right career decision.
|
||||
|
||||
## Data science vs. machine learning: Which career path fits your background?
|
||||
|
||||
If you have a background in statistics, data analysis, and business intelligence, data science could be the perfect match for you. Data science is all about turning raw data into valuable insights that businesses can act on. Your familiarity with working with data makes it easier to spot patterns and trends, which is a key part of what data scientists do. It's a role that requires both creative problem-solving and analytical thinking.
|
||||
|
||||
Machine learning, on the other hand, is better suited for you if you have a strong foundation in mathematics, programming, and computer science. A machine learning expert builds algorithms that can learn from data without explicitly programming them. It requires a solid grasp of concepts like linear algebra, calculus, probability, and algorithm design. If these are skills you already have, this path is a natural fit for you.
|
||||
|
||||
## Data science vs. machine learning: Which path pays off in the long run?
|
||||
|
||||
Both machine learning and data science offer exciting and rewarding career paths, especially with the growing demand for AI across industries.
|
||||
|
||||
In data science, you typically start your career with entry-level positions like Data Analyst or Business Intelligence Analyst and can evolve into leadership roles like Chief Data Officer. This career path is appealing because it allows you to collaborate with both technical teams and business stakeholders, solving real-world problems with data-driven insights.
|
||||
|
||||
A typical career progression in data science involves:
|
||||
|
||||
- Data Analyst
|
||||
- Data Scientist
|
||||
- Senior Data Scientist
|
||||
- Analytics Manager
|
||||
- Chief Data Officer
|
||||
|
||||

|
||||
|
||||
Machine learning careers tend to offer slightly higher salaries due to the specialized skills in programming and algorithm design. A machine learning professional typically starts as a machine learning engineer and can progress to advanced roles like Head of AI/ML, focusing on developing intelligent systems and cutting-edge AI solutions.
|
||||
|
||||
A typical career progression in machine learning involves:
|
||||
|
||||
- Machine Learning Engineer
|
||||
- AI Specialist
|
||||
- Deep Learning Engineer
|
||||
- AI Research Scientist
|
||||
- Head of AI/ML
|
||||
|
||||

|
||||
|
||||
Both paths provide excellent growth opportunities, but your choice should align with your background and long-term career goals.
|
||||
|
||||
## Data science vs. machine learning: Which opportunities are available for you?
|
||||
|
||||
In terms of opportunities, data scientist are in higher demand across various industries that need data-driven insight to make decisions and improve their processes. These include companies within healthcare, finance, marketing, retail, and e-commerce. So, if your goal is to work in diverse industries that rely on data insights, then data science is an ideal choice.
|
||||
|
||||
Machine learning, on the other hand, is more likely to work in technology-focused sectors where prediction, automation, and intelligence systems are at the core of their operation. These include industries like robotics, research and development labs, and autonomous vehicles. As a result, opportunities in machine learning may be harder to come by compared to data science, as machine learning professionals often work in more specialized and focused environments. However, if you're drawn to tech-driven fields involving autonomous systems or AI research, machine learning could be an ideal path for you.
|
||||
|
||||
## Machine learning vs. data science: Which balances creativity and tech better?
|
||||
|
||||
Data science strikes a balance between technical expertise and creativity. It's all about taking complex data and transforming it into meaningful insights that non-technical stakeholders can easily understand. If you enjoy solving problems creatively and telling compelling stories with data, data science would be a great fit for you.
|
||||
|
||||
Machine learning, on the other hand, is more technical and involves developing algorithms. It involves designing, training, and optimizing models that enable machines to learn and make predictions. If you love tackling technical challenges like developing algorithms and building AI models from the ground up, then a career in machine learning would be ideal for you.
|
||||
|
||||
As a rule of thumb, use the decision tree table to choose between data science and machine learning:
|
||||
|
||||

|
||||
|
||||
Choosing between data science and machine learning ultimately depends on your interests and career goals. Both fields offer rewarding opportunities and career growth. The key is to understand what excites you most: extracting meaning from data or building intelligent systems.
|
||||
|
||||
If you're considering starting a career as a data scientist, explore our comprehensive [data science roadmap](https://roadmap.sh/ai-data-scientist) for actionable steps and valuable resources to get started.
|
||||
@@ -91,7 +91,7 @@ And in case of authorization failure, i.e., if the user tries to perform an oper
|
||||
|
||||
Given below is the list of common authentication strategies:
|
||||
|
||||
- Basic Authentication
|
||||
- Basics of Authentication
|
||||
- Session Based Authentication
|
||||
- Token-Based Authentication
|
||||
- JWT Authentication
|
||||
|
||||
Some files were not shown because too many files have changed in this diff Show More
Reference in New Issue
Block a user